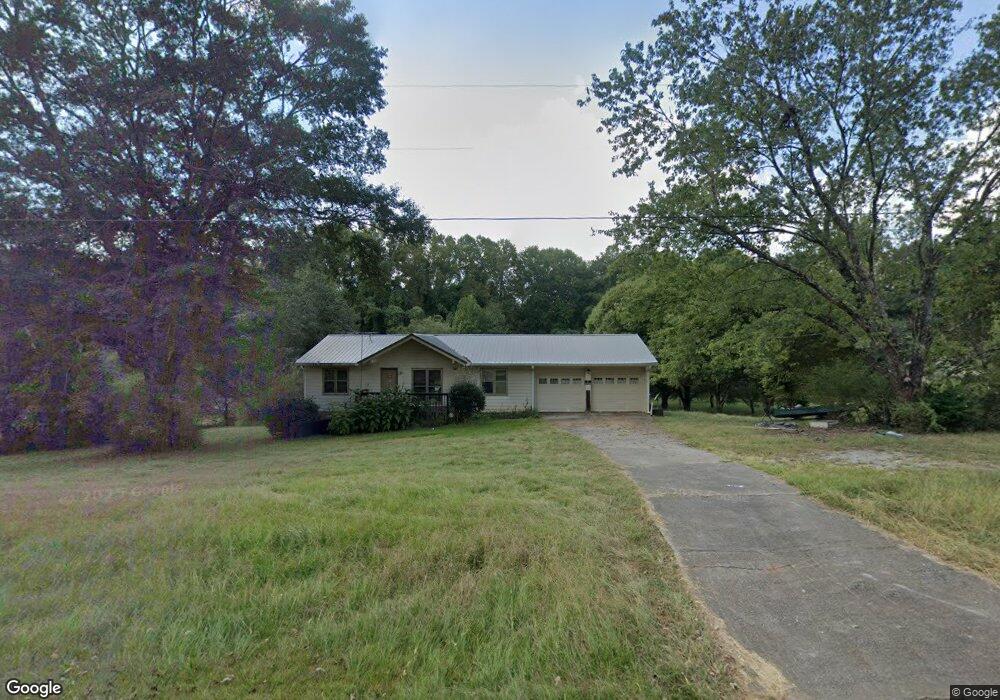
1738 Hays Mill Rd Carrollton, GA 30117
Estimated Value: $203,000 - $283,000
3
Beds
2
Baths
1,290
Sq Ft
$182/Sq Ft
Est. Value
About This Home
This home is located at 1738 Hays Mill Rd, Carrollton, GA 30117 and is currently estimated at $234,366, approximately $181 per square foot. 1738 Hays Mill Rd is a home located in Carroll County with nearby schools including Central Elementary School, Central Middle School, and Central High School.
Ownership History
Date
Name
Owned For
Owner Type
Purchase Details
Closed on
Feb 11, 2016
Sold by
Hinman Judy
Bought by
Properties Llc
Current Estimated Value
Purchase Details
Closed on
Feb 20, 2013
Sold by
Sanders Ara Bell
Bought by
Hinman Judy
Purchase Details
Closed on
Mar 25, 2011
Sold by
Sanders Virgil R Estate
Bought by
Sanders Ara Bell
Purchase Details
Closed on
Oct 15, 2004
Sold by
Sanders Virgil R
Bought by
Sanders Virgil R & Ara Bell (Jtrs)
Purchase Details
Closed on
Jul 28, 2004
Sold by
Roberson Dustin Shan
Bought by
Sanders Virgil R & Ara Bell (Jtrs)
Purchase Details
Closed on
Nov 12, 1997
Sold by
Roberson Dustin Shan
Bought by
Roberson Dustin Shan
Purchase Details
Closed on
Nov 11, 1997
Sold by
Beard Beard S and Beard Ola
Bought by
Roberson Dustin Shan
Purchase Details
Closed on
Aug 17, 1986
Bought by
Beard Beard S and Beard Ola
Create a Home Valuation Report for This Property
The Home Valuation Report is an in-depth analysis detailing your home's value as well as a comparison with similar homes in the area
Home Values in the Area
Average Home Value in this Area
Purchase History
| Date | Buyer | Sale Price | Title Company |
|---|---|---|---|
| Properties Llc | -- | -- | |
| Hinman Judy | $54,680 | -- | |
| Sanders Ara Bell | -- | -- | |
| Sanders Virgil R & Ara Bell (Jtrs) | -- | -- | |
| Sanders Virgil R | -- | -- | |
| Sanders Virgil R | -- | -- | |
| Sanders Virgil R & Ara Bell (Jtrs) | $106,000 | -- | |
| Roberson Dustin Shan | -- | -- | |
| Roberson Dustin Shan | $76,000 | -- | |
| Beard Beard S | -- | -- |
Source: Public Records
Tax History Compared to Growth
Tax History
| Year | Tax Paid | Tax Assessment Tax Assessment Total Assessment is a certain percentage of the fair market value that is determined by local assessors to be the total taxable value of land and additions on the property. | Land | Improvement |
|---|---|---|---|---|
| 2024 | $1,162 | $51,352 | $3,334 | $48,018 |
| 2023 | $1,162 | $57,059 | $8,537 | $48,522 |
| 2022 | $1,119 | $44,607 | $5,691 | $38,916 |
| 2021 | $812 | $31,662 | $3,454 | $28,208 |
| 2020 | $813 | $31,662 | $3,454 | $28,208 |
| 2019 | $965 | $36,477 | $4,139 | $32,338 |
| 2018 | $682 | $25,964 | $2,672 | $23,292 |
| 2017 | $684 | $25,964 | $2,672 | $23,292 |
| 2016 | $733 | $32,744 | $3,370 | $29,374 |
| 2015 | $841 | $25,964 | $5,177 | $20,787 |
| 2014 | $614 | $36,437 | $8,000 | $28,437 |
Source: Public Records
Map
Nearby Homes
- 1585 Hays Mill Rd
- 400 Stripling Chapel Rd
- 1250 Hays Mill Rd
- 2214 Hays Mill Rd
- 915 Oak Grove Rd
- 533 Buffalo Creek Rd
- 0 Buffalo Creek Rd Unit 10624169
- 121 Carson Place
- 2492 Oak Grove Church Rd
- 135 Gray Rd
- 116 Manor Way
- 111 Vineyard Walk
- 111 Vineyard Walk Unit LOT 78
- 113 Vineyard Walk
- 113 Vineyard Walk Unit LOT 77
- Plan 1643 at Windmill Park
- Plan 1830 at Windmill Park
- 203 Vineyard Walk Unit LOT 74
- 203 Vineyard Walk
- 1720 Hays Mill Rd
- 1734 Hays Mill Rd
- 1734 Hays Mill Rd
- 1760 Hays Mill Rd
- 1700 Hays Mill Rd
- 1640 Hays Mill Rd
- 1640 Hays Mill Rd Unit 1
- 1680 Hays Mill Rd
- 1810 Hays Mill Rd
- 1691 Hays Mill Rd
- 1620 Hays Mill Rd
- 130 Sweetbriar Ln
- 1590 Hays Mill Rd
- 3168 Oak Grove Church Rd
- 3198 Oak Grove Church Rd
- 156 Sweetbriar Ln
- 156 Sweetbriar Ln
- 3264 Oak Grove Church Rd
- 114 Sweetbriar Ln
- 520 Buffalo Creek Rd