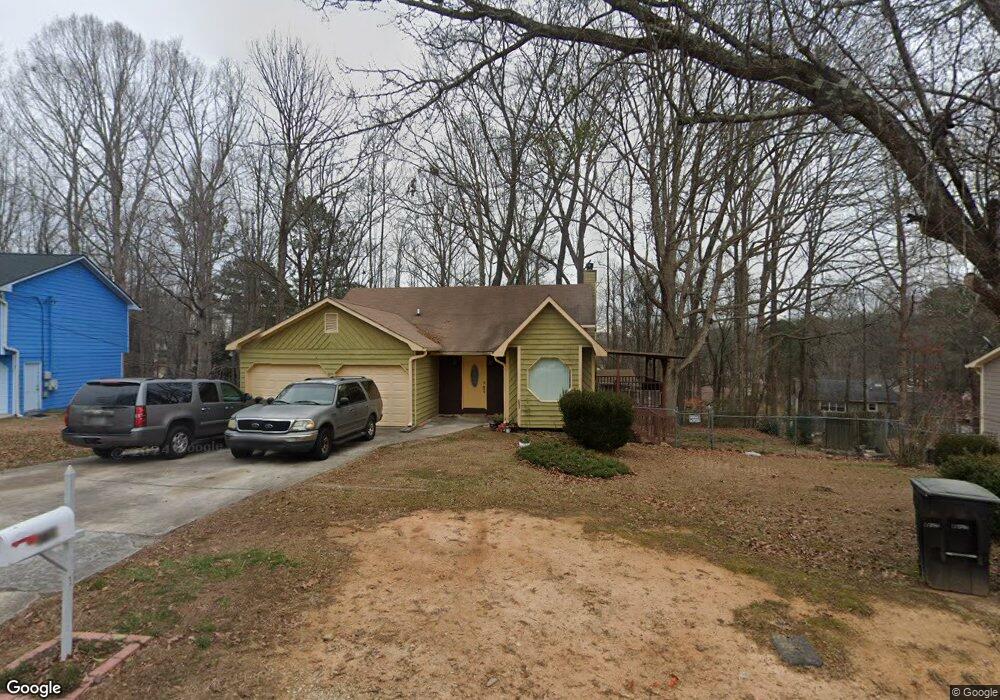
1738 Olde Oak Dr Lithia Springs, GA 30122
Lithia Springs NeighborhoodEstimated Value: $253,531 - $304,000
3
Beds
2
Baths
1,566
Sq Ft
$181/Sq Ft
Est. Value
About This Home
This home is located at 1738 Olde Oak Dr, Lithia Springs, GA 30122 and is currently estimated at $282,883, approximately $180 per square foot. 1738 Olde Oak Dr is a home located in Douglas County with nearby schools including Sweetwater Elementary School, Factory Shoals Middle School, and Lithia Springs Comprehensive High School.
Ownership History
Date
Name
Owned For
Owner Type
Purchase Details
Closed on
Oct 7, 2009
Sold by
Bardales Jose D
Bought by
Bardales Jose D and Munoz Angelica
Current Estimated Value
Purchase Details
Closed on
Mar 3, 2009
Sold by
Mason Gary
Bought by
Nomura Home Series 2007-2
Purchase Details
Closed on
Apr 19, 2000
Sold by
Griffith Mark S
Bought by
Mason Gary
Home Financials for this Owner
Home Financials are based on the most recent Mortgage that was taken out on this home.
Original Mortgage
$95,951
Interest Rate
8.27%
Mortgage Type
FHA
Purchase Details
Closed on
Feb 10, 2000
Sold by
Hud
Bought by
Griffith Mark S
Purchase Details
Closed on
Feb 2, 1999
Sold by
Ge Mtg Svcs Inc
Bought by
Hud
Create a Home Valuation Report for This Property
The Home Valuation Report is an in-depth analysis detailing your home's value as well as a comparison with similar homes in the area
Home Values in the Area
Average Home Value in this Area
Purchase History
| Date | Buyer | Sale Price | Title Company |
|---|---|---|---|
| Bardales Jose D | -- | -- | |
| Bardales Jose D | $35,000 | -- | |
| Nomura Home Series 2007-2 | $54,870 | -- | |
| Mason Gary | $96,000 | -- | |
| Griffith Mark S | -- | -- | |
| Hud | -- | -- | |
| Capital Mtg Svcs Inc | $84,966 | -- |
Source: Public Records
Mortgage History
| Date | Status | Borrower | Loan Amount |
|---|---|---|---|
| Previous Owner | Mason Gary | $95,951 |
Source: Public Records
Tax History Compared to Growth
Tax History
| Year | Tax Paid | Tax Assessment Tax Assessment Total Assessment is a certain percentage of the fair market value that is determined by local assessors to be the total taxable value of land and additions on the property. | Land | Improvement |
|---|---|---|---|---|
| 2024 | $2,296 | $98,440 | $21,280 | $77,160 |
| 2023 | $2,296 | $98,440 | $21,280 | $77,160 |
| 2022 | $2,031 | $81,560 | $17,000 | $64,560 |
| 2021 | $1,548 | $57,280 | $11,000 | $46,280 |
| 2020 | $1,571 | $57,280 | $11,000 | $46,280 |
| 2019 | $1,470 | $55,400 | $11,000 | $44,400 |
| 2018 | $1,303 | $47,000 | $9,560 | $37,440 |
| 2017 | $1,229 | $42,560 | $9,560 | $33,000 |
| 2016 | $1,100 | $35,680 | $8,320 | $27,360 |
| 2015 | $960 | $30,796 | $7,360 | $23,436 |
| 2014 | $1,026 | $32,228 | $8,200 | $24,028 |
| 2013 | -- | $34,240 | $8,720 | $25,520 |
Source: Public Records
Map
Nearby Homes
- 1774 Trail Creek Dr
- 1535 Olde Oak Dr
- 3686 Sweetbriar Cir
- 3652 Sweetbriar Cir
- 8816 Sibella Ct
- 3570 Briar Dr
- 2436 Falls River Dr
- 3790 Sweetbriar Cir
- 3646 Briar Dr
- 2499 Chestnut Log Loop
- 1815 Lee Rd
- 1940 Lee
- 2071 Oakcreek Dr
- HAYDEN Plan at Fairhaven
- GREEN Plan at Fairhaven
- CALI Plan at Fairhaven
- ELLE Plan at Fairhaven
- PENWELL Plan at Fairhaven
- 1928 Stonewood Dr
- 3924 Fairhaven Rd
- 1728 Olde Oak Dr
- 1748 Olde Oak Dr Unit 1
- 1747 Trail Creek Dr
- 2710 Trail Creek Cir
- 2710 Trail Creek Cir Unit 87
- 2740 Trail Creek Cir
- 1718 Olde Oak Dr
- 1715 Olde Oak Dr
- 1727 Trail Creek Dr
- 1705 Olde Oak Dr
- 2700 Trail Creek Cir
- 1708 Olde Oak Dr Unit 1
- 4275 Winding Creek Dr
- 1717 Trail Creek Dr
- 2707 Woodbine Trail
- 2750 Trail Creek Cir
- 2733 Trail Creek Cir
- 1724 Trail Creek Dr
- 1734 Trail Creek Dr Unit 106
- 1734 Trail Creek Dr