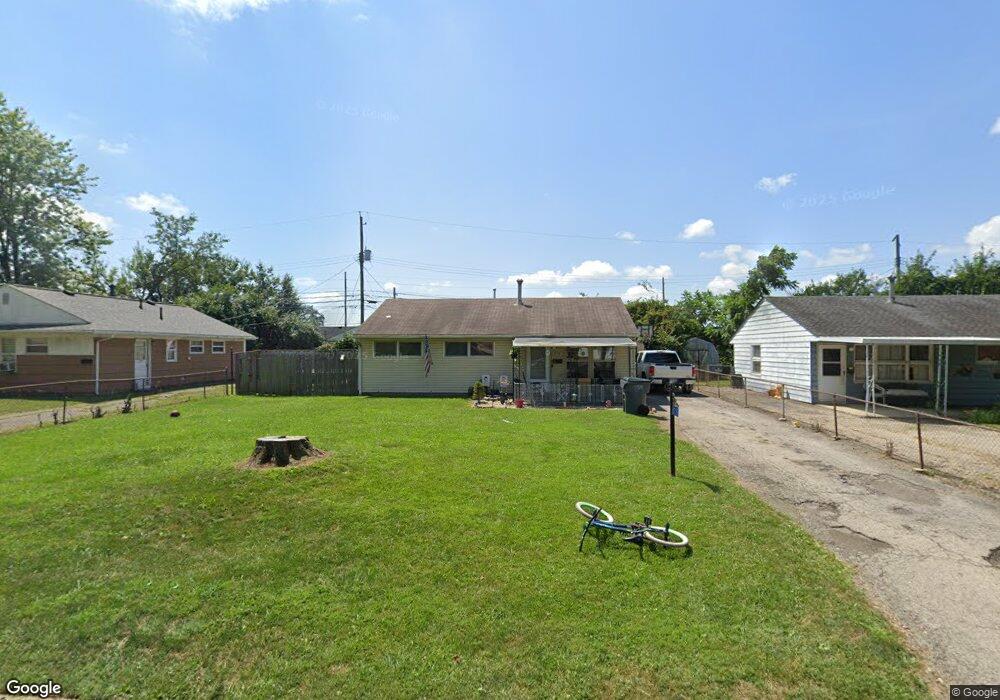
1739 Eastbrook Dr S Columbus, OH 43223
Estimated Value: $153,836 - $192,000
3
Beds
1
Bath
925
Sq Ft
$185/Sq Ft
Est. Value
About This Home
This home is located at 1739 Eastbrook Dr S, Columbus, OH 43223 and is currently estimated at $170,709, approximately $184 per square foot. 1739 Eastbrook Dr S is a home located in Franklin County with nearby schools including Finland Elementary School, Franklin Woods Intermediate School, and Finland Middle School.
Ownership History
Date
Name
Owned For
Owner Type
Purchase Details
Closed on
Sep 13, 2017
Sold by
Dewalt Lee C and Colonial Nm
Bought by
H And O Properties Llc
Current Estimated Value
Purchase Details
Closed on
Sep 30, 2005
Sold by
Wood David and Wood Lisa
Bought by
Dewalt Lee C and Dewalt Shelly
Home Financials for this Owner
Home Financials are based on the most recent Mortgage that was taken out on this home.
Original Mortgage
$76,277
Interest Rate
5.83%
Mortgage Type
FHA
Purchase Details
Closed on
Aug 2, 2004
Sold by
Colburn David C
Bought by
Wood David and Wood Lisa
Home Financials for this Owner
Home Financials are based on the most recent Mortgage that was taken out on this home.
Original Mortgage
$39,000
Interest Rate
5.5%
Mortgage Type
Purchase Money Mortgage
Purchase Details
Closed on
Jan 22, 1991
Bought by
Colburn David C
Purchase Details
Closed on
Mar 15, 1989
Purchase Details
Closed on
May 13, 1988
Create a Home Valuation Report for This Property
The Home Valuation Report is an in-depth analysis detailing your home's value as well as a comparison with similar homes in the area
Home Values in the Area
Average Home Value in this Area
Purchase History
| Date | Buyer | Sale Price | Title Company |
|---|---|---|---|
| H And O Properties Llc | $39,000 | None Available | |
| Dewalt Lee C | $76,900 | Chicago Tit | |
| Wood David | $52,000 | Chelsea Tit | |
| Colburn David C | $42,100 | -- | |
| -- | $42,500 | -- | |
| -- | $26,800 | -- |
Source: Public Records
Mortgage History
| Date | Status | Borrower | Loan Amount |
|---|---|---|---|
| Previous Owner | Dewalt Lee C | $76,277 | |
| Previous Owner | Wood David | $39,000 | |
| Closed | Wood David | $7,800 |
Source: Public Records
Tax History Compared to Growth
Tax History
| Year | Tax Paid | Tax Assessment Tax Assessment Total Assessment is a certain percentage of the fair market value that is determined by local assessors to be the total taxable value of land and additions on the property. | Land | Improvement |
|---|---|---|---|---|
| 2024 | $2,214 | $42,460 | $7,740 | $34,720 |
| 2023 | $2,203 | $42,455 | $7,735 | $34,720 |
| 2022 | $1,634 | $21,670 | $9,100 | $12,570 |
| 2021 | $1,555 | $21,670 | $9,100 | $12,570 |
| 2020 | $1,553 | $21,670 | $9,100 | $12,570 |
| 2019 | $1,393 | $17,430 | $7,560 | $9,870 |
| 2018 | $1,336 | $17,430 | $7,560 | $9,870 |
| 2017 | $677 | $17,430 | $7,560 | $9,870 |
| 2016 | $1,333 | $16,170 | $3,360 | $12,810 |
| 2015 | $1,237 | $16,170 | $3,360 | $12,810 |
| 2014 | $1,238 | $16,170 | $3,360 | $12,810 |
| 2013 | $715 | $19,005 | $3,955 | $15,050 |
Source: Public Records
Map
Nearby Homes
- 1607 Red Leaf Ln
- 1948 Big Run Bluffs Blvd
- 1543 Red Leaf Ln
- 1949 Big Run Bluffs Blvd
- 1417 Fahy Dr
- 1390 Gray Meadow Dr
- 2210 October Ridge Dr
- 1723 Farberdale Dr
- 4745 Big Run Rd E
- 0 S Central Ave
- 1532 Westmeadow Dr
- 2436 Onyx Ct
- 1994 Little Ave
- 1969 Forest Lake Ct
- 2272 Anndel Ct
- 1663 Hopkins Ave
- 2242 Topaz Dr
- 1540 Little Ave
- 2272 Topaz Dr
- 1122 Harrisburg Pike
- 1733 Eastbrook Dr S
- 1747 Eastbrook Dr S
- 1746 Frank Rd Unit 748
- 1752 Frank Rd Unit 754
- 1738 Frank Rd
- 1725 Eastbrook Dr S
- 1755 Eastbrook Dr S
- 1740 Eastbrook Dr S
- 1734 Eastbrook Dr S
- 1748 Eastbrook Dr S
- 1760 Frank Rd Unit 762
- 1730 Frank Rd Unit 732
- 1730-1732 Frank Rd
- 1724 Eastbrook Dr S
- 1763 Eastbrook Dr S
- 1756 Eastbrook Dr S
- 1717 Eastbrook Dr S
- 1722 Frank Rd Unit 1724
- 1722 Frank Rd Unit 724
- 1716 Eastbrook Dr S