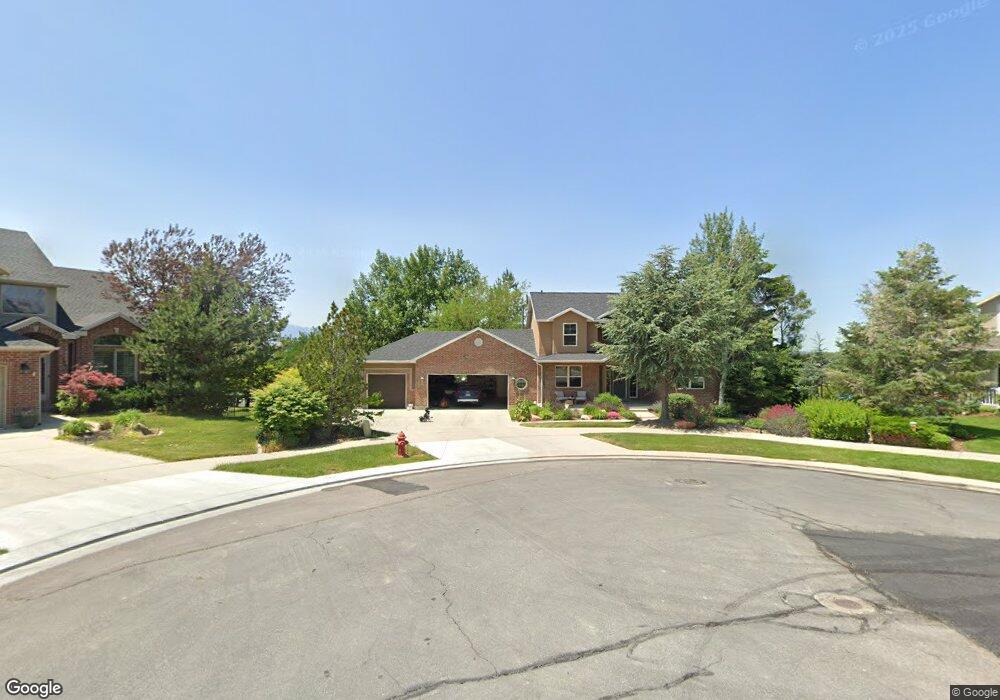
1739 Horizon Point Cir Draper, UT 84020
Estimated Value: $1,159,000 - $1,302,000
5
Beds
3
Baths
3,266
Sq Ft
$381/Sq Ft
Est. Value
About This Home
This home is located at 1739 Horizon Point Cir, Draper, UT 84020 and is currently estimated at $1,243,446, approximately $380 per square foot. 1739 Horizon Point Cir is a home located in Salt Lake County with nearby schools including Draper Park Middle School, Corner Canyon High School, and Summit Academy - Draper Elementary Campus.
Ownership History
Date
Name
Owned For
Owner Type
Purchase Details
Closed on
Jul 20, 2021
Sold by
Evenson Rick D and Evenson Lisa C
Bought by
Evenson Lisa and Evenson Rick
Current Estimated Value
Home Financials for this Owner
Home Financials are based on the most recent Mortgage that was taken out on this home.
Original Mortgage
$506,000
Outstanding Balance
$459,537
Interest Rate
2.96%
Mortgage Type
New Conventional
Estimated Equity
$783,909
Purchase Details
Closed on
May 26, 1998
Sold by
Evenson Rick and Evenson Lisa
Bought by
Evenson Rick D and Evenson Lisa C
Purchase Details
Closed on
Mar 26, 1998
Sold by
M L R Enterprises L C
Bought by
Evenson Rick and Evenson Lisa
Home Financials for this Owner
Home Financials are based on the most recent Mortgage that was taken out on this home.
Original Mortgage
$50,000
Interest Rate
7.06%
Create a Home Valuation Report for This Property
The Home Valuation Report is an in-depth analysis detailing your home's value as well as a comparison with similar homes in the area
Home Values in the Area
Average Home Value in this Area
Purchase History
| Date | Buyer | Sale Price | Title Company |
|---|---|---|---|
| Evenson Lisa | -- | First American Title | |
| Evenson Rick D | -- | -- | |
| Evenson Rick | -- | -- |
Source: Public Records
Mortgage History
| Date | Status | Borrower | Loan Amount |
|---|---|---|---|
| Open | Evenson Lisa | $506,000 | |
| Previous Owner | Evenson Rick | $50,000 |
Source: Public Records
Tax History Compared to Growth
Tax History
| Year | Tax Paid | Tax Assessment Tax Assessment Total Assessment is a certain percentage of the fair market value that is determined by local assessors to be the total taxable value of land and additions on the property. | Land | Improvement |
|---|---|---|---|---|
| 2025 | $4,777 | $979,700 | $519,900 | $459,800 |
| 2024 | $4,777 | $912,500 | $508,800 | $403,700 |
| 2023 | $4,698 | $890,900 | $398,600 | $492,300 |
| 2022 | $4,854 | $889,100 | $390,800 | $498,300 |
| 2021 | $4,512 | $706,000 | $325,600 | $380,400 |
| 2020 | $4,419 | $655,400 | $323,300 | $332,100 |
| 2019 | $4,491 | $650,800 | $321,000 | $329,800 |
| 2018 | $4,066 | $602,200 | $284,100 | $318,100 |
| 2017 | $4,057 | $575,600 | $284,100 | $291,500 |
| 2016 | $4,067 | $560,800 | $284,100 | $276,700 |
| 2015 | $4,333 | $553,300 | $233,900 | $319,400 |
| 2014 | $4,147 | $517,200 | $220,000 | $297,200 |
Source: Public Records
Map
Nearby Homes
- 13353 S Peach Orchard Ct
- 12882 S Ellerbeck Ln Unit 12882
- 12838 Hickory Ridge Ln
- 13307 S 1300 E
- 13050 S 1300 E
- 13460 S 1300 E
- 1671 Timoney Rd
- 1201 E 13200 S Unit 4
- 1803 Crimson Oak Dr
- 13826 S Tom Shoemaker Cir
- 13216 S Telemark Ln
- 12671 S Somerdowns Ct
- 13294 Trail Rider Cir
- 13881 Vestry Rd
- 13302 S Corner Wood Dr
- 963 Old English Rd
- 12959 S Fort St
- 14138 S Spyglass Hill Dr
- 12182 S Pine Valley Way
- 2019 E Graystone Ct
- 1739 Horizon Point Cir Unit 223
- 1747 E Horizon Point Cir Unit 224
- 1747 Horizon Point Cir
- 1747 Horizon Point Cir Unit 224
- 1742 E Horizon Point Cir Unit 222
- 1742 Horizon Point Cir
- 1742 E Horizon Point Cir Unit 222
- 1742 E Horizon Point Cir
- 1819 E 13200 S
- 13158 S Horizon Point Dr
- 13158 Horizon Point Dr
- 1754 E Horizon Point Cir
- 1754 E Horizon Point Cir
- 1754 Horizon Point Cir
- 1661 E 13200 S
- 1743 Horizon Point Cir Unit 229
- 1751 Horizon Point Cir Unit 230
- 13144 Horizon Point Dr
- 13144 S Horizon Point Dr Unit 226
- 13144 S Horizon Point Dr