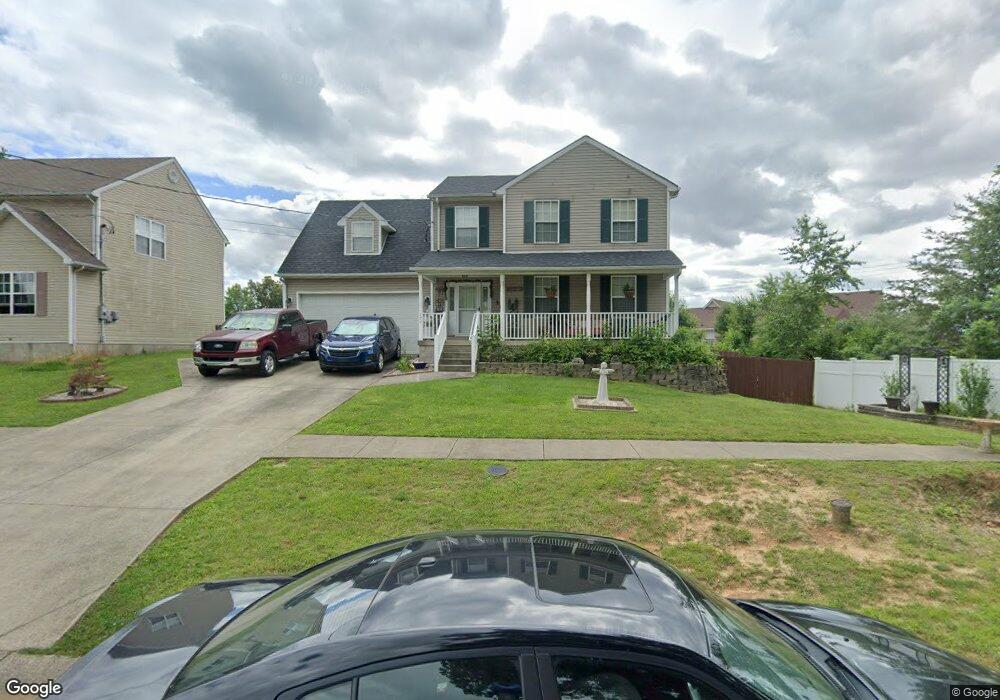
174 Byerly Blvd Radcliff, KY 40160
Estimated Value: $264,000 - $307,000
4
Beds
3
Baths
2,059
Sq Ft
$135/Sq Ft
Est. Value
About This Home
This home is located at 174 Byerly Blvd, Radcliff, KY 40160 and is currently estimated at $278,387, approximately $135 per square foot. 174 Byerly Blvd is a home located in Hardin County with nearby schools including Woodland Elementary School, North Middle School, and John Hardin High School.
Ownership History
Date
Name
Owned For
Owner Type
Purchase Details
Closed on
Jun 15, 2010
Sold by
Goes Mark D and Goes Jovilita O
Bought by
Carver Jeffery K and Carver Teresa A
Current Estimated Value
Home Financials for this Owner
Home Financials are based on the most recent Mortgage that was taken out on this home.
Original Mortgage
$143,073
Outstanding Balance
$98,346
Interest Rate
5.5%
Mortgage Type
FHA
Estimated Equity
$180,041
Purchase Details
Closed on
Jan 26, 2009
Sold by
Coleman Mark and Coleman Brenda
Bought by
Goes Mark D and Goes Jovilita O
Purchase Details
Closed on
Nov 10, 2005
Sold by
Beyer Michael R and Beyer Jeong J
Bought by
Coleman Mark and Coleman Brenda
Home Financials for this Owner
Home Financials are based on the most recent Mortgage that was taken out on this home.
Original Mortgage
$132,000
Interest Rate
6.75%
Mortgage Type
Adjustable Rate Mortgage/ARM
Create a Home Valuation Report for This Property
The Home Valuation Report is an in-depth analysis detailing your home's value as well as a comparison with similar homes in the area
Home Values in the Area
Average Home Value in this Area
Purchase History
| Date | Buyer | Sale Price | Title Company |
|---|---|---|---|
| Carver Jeffery K | $145,000 | None Available | |
| Goes Mark D | $124,100 | None Available | |
| Coleman Mark | $165,000 | None Available |
Source: Public Records
Mortgage History
| Date | Status | Borrower | Loan Amount |
|---|---|---|---|
| Open | Carver Jeffery K | $143,073 | |
| Previous Owner | Coleman Mark | $132,000 | |
| Previous Owner | Coleman Mark | $33,000 |
Source: Public Records
Tax History Compared to Growth
Tax History
| Year | Tax Paid | Tax Assessment Tax Assessment Total Assessment is a certain percentage of the fair market value that is determined by local assessors to be the total taxable value of land and additions on the property. | Land | Improvement |
|---|---|---|---|---|
| 2024 | $1,625 | $218,700 | $21,700 | $197,000 |
| 2023 | $218 | $151,600 | $21,700 | $129,900 |
| 2022 | $1,448 | $151,600 | $21,700 | $129,900 |
| 2021 | $1,641 | $151,600 | $21,700 | $129,900 |
| 2020 | $1,657 | $151,600 | $21,700 | $129,900 |
| 2019 | $231 | $148,000 | $0 | $0 |
| 2018 | $1,584 | $148,000 | $0 | $0 |
| 2017 | $1,577 | $148,000 | $0 | $0 |
| 2016 | $231 | $148,000 | $0 | $0 |
| 2015 | $1,267 | $145,000 | $0 | $0 |
| 2012 | -- | $145,000 | $0 | $0 |
Source: Public Records
Map
Nearby Homes
- 219 Meadowlake Dr
- Lot 269 Byerly Blvd Unit 269 Hilltop Terrace
- 5013 S Woodland Dr
- 158 Donna Ave
- 149 Bivins Ct
- 3004 S Woodland Dr
- 114 Amanda Ct
- 2634 Lake Rd N
- 102 Larkspur Dr
- 2630 Lake Rd N
- 2671 Lake Rd N
- 7223 S Woodland Dr
- 2851 S Wilson Rd
- DUPONT Plan at Shelton Woods
- ESSEX Plan at Shelton Woods
- 12 Marbury Dr
- 12 Stodmire Ct
- LOT 113 Joshua Ct
- 209 S Wilson Rd Unit lots 2 & 3 Atcher Di
- 200 Lilac Ct
- 172 Byerly Blvd
- 246 Meadowlake Dr
- 104 Aster Dr
- 170 Byerly Blvd
- 4800 S Woodland Dr
- 234 Meadowlake Dr
- 173 Byerly Blvd
- 106 Aster Dr
- 171 Byerly Blvd
- 102 Wiselyn Dr
- 169 Byerly Blvd
- 4900 S Woodland Dr
- 100 Wiselyn Dr
- 247 Meadowlake Dr
- 250 Meadowlake Dr
- 167 Byerly Blvd
- 165 Byerly Blvd
- 103 Aster Dr
- 224 Meadowlake Dr
- 104 Wiselyn Dr