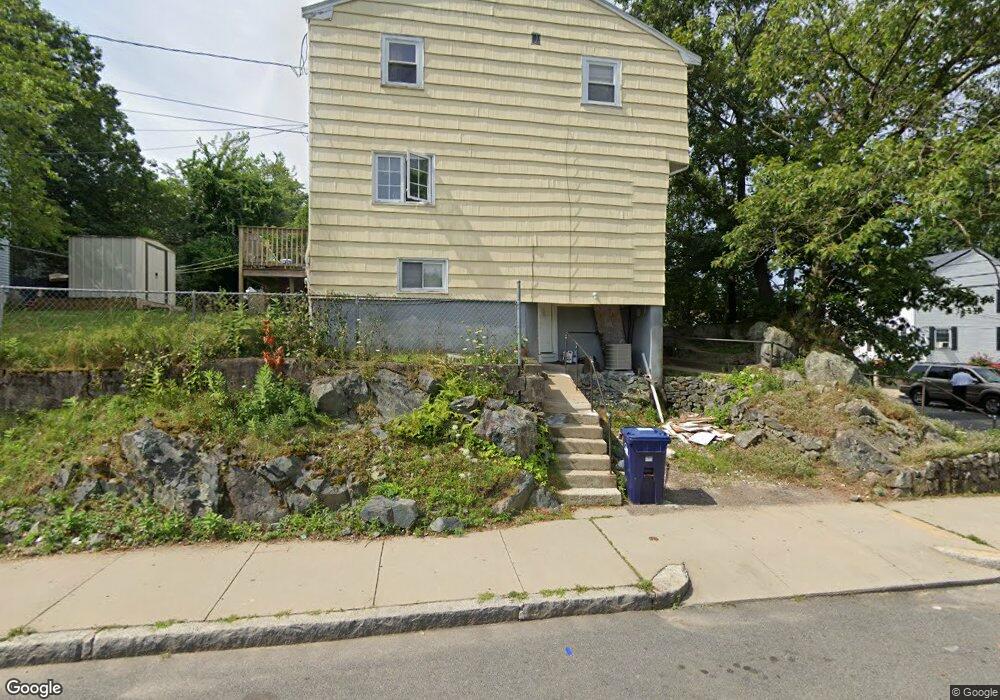
174 Delhi St Mattapan, MA 02126
Southern Mattapan NeighborhoodEstimated Value: $489,000 - $609,916
3
Beds
2
Baths
1,160
Sq Ft
$494/Sq Ft
Est. Value
About This Home
This home is located at 174 Delhi St, Mattapan, MA 02126 and is currently estimated at $572,979, approximately $493 per square foot. 174 Delhi St is a home located in Suffolk County with nearby schools including KIPP Academy Boston Charter School and Berea Seventh-day Adventist Academy.
Ownership History
Date
Name
Owned For
Owner Type
Purchase Details
Closed on
Aug 19, 2004
Sold by
Chandool Deonarine
Bought by
Ellison Marlene M
Current Estimated Value
Home Financials for this Owner
Home Financials are based on the most recent Mortgage that was taken out on this home.
Original Mortgage
$239,120
Outstanding Balance
$118,813
Interest Rate
6.03%
Mortgage Type
Purchase Money Mortgage
Estimated Equity
$454,166
Create a Home Valuation Report for This Property
The Home Valuation Report is an in-depth analysis detailing your home's value as well as a comparison with similar homes in the area
Home Values in the Area
Average Home Value in this Area
Purchase History
| Date | Buyer | Sale Price | Title Company |
|---|---|---|---|
| Ellison Marlene M | $298,900 | -- |
Source: Public Records
Mortgage History
| Date | Status | Borrower | Loan Amount |
|---|---|---|---|
| Open | Ellison Marlene M | $239,120 | |
| Previous Owner | Ellison Marlene M | $148,000 |
Source: Public Records
Tax History Compared to Growth
Tax History
| Year | Tax Paid | Tax Assessment Tax Assessment Total Assessment is a certain percentage of the fair market value that is determined by local assessors to be the total taxable value of land and additions on the property. | Land | Improvement |
|---|---|---|---|---|
| 2025 | $5,752 | $496,700 | $119,000 | $377,700 |
| 2024 | $5,690 | $522,000 | $123,100 | $398,900 |
| 2023 | $5,339 | $497,100 | $117,200 | $379,900 |
| 2022 | $5,103 | $469,000 | $110,600 | $358,400 |
| 2021 | $5,004 | $469,000 | $110,600 | $358,400 |
| 2020 | $3,697 | $350,100 | $104,100 | $246,000 |
| 2019 | $3,448 | $327,100 | $78,200 | $248,900 |
| 2018 | $3,205 | $305,800 | $78,200 | $227,600 |
| 2017 | $3,205 | $302,600 | $78,200 | $224,400 |
| 2016 | $2,895 | $263,200 | $78,200 | $185,000 |
| 2015 | $2,760 | $227,900 | $80,100 | $147,800 |
| 2014 | $2,677 | $212,800 | $80,100 | $132,700 |
Source: Public Records
Map
Nearby Homes
- 157 Delhi St
- 32 Violet St
- 11 French St
- 567B Norfolk St
- 4 Crossman St Unit 4
- 25 Fessenden St
- 23 Fessenden St
- 12 Hiawatha Rd
- 710 Walk Hill St
- 1465 Blue Hill Ave
- 45 1st Ave Unit 111
- 24 Constitution Rd
- 18 Astoria St
- 58 Mattapan St
- 10 Briarcliff Terrace
- 49 Fottler Rd
- 10 Hosmer St
- 30 Glenhill Rd
- 10 Itasca St
- 10 Sutton St
- 34 Halborn St
- 39 Halborn St
- 35 Halborn St
- 177 Delhi St
- 173 Delhi St
- 64 Violet St
- 167 Delhi St Unit 3
- 167 Delhi St Unit 2
- 31 Halborn St
- 181 Delhi St
- 30 Halborn St
- 165 Delhi St Unit 2
- 165 Delhi St Unit 1
- 165 Delhi St Unit 3
- 60 Violet St
- 189 Delhi St
- 27 Halborn St
- 163 Delhi St Unit 3
- 163 Delhi St
- 163 Delhi St Unit 2