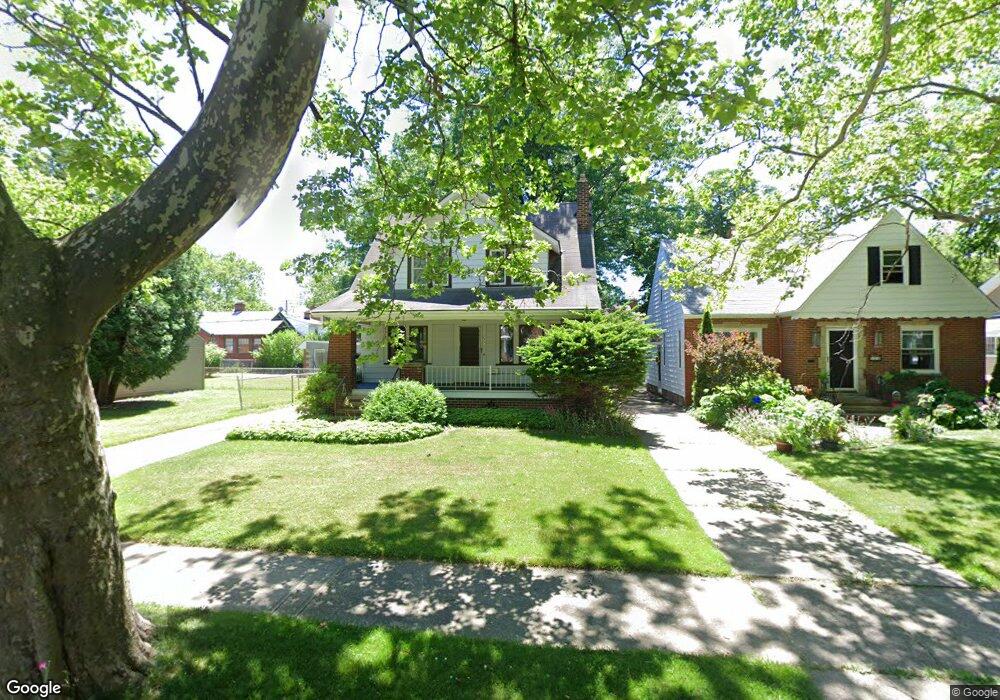
174 E 213th St Euclid, OH 44123
Estimated Value: $165,121 - $188,000
3
Beds
2
Baths
1,456
Sq Ft
$121/Sq Ft
Est. Value
About This Home
This home is located at 174 E 213th St, Euclid, OH 44123 and is currently estimated at $175,530, approximately $120 per square foot. 174 E 213th St is a home located in Cuyahoga County with nearby schools including Arbor Elementary School, Euclid Middle School, and Euclid High School.
Ownership History
Date
Name
Owned For
Owner Type
Purchase Details
Closed on
Jul 24, 2024
Sold by
Harper Jack E and Harper Pa
Bought by
Sonders Street Llc
Current Estimated Value
Purchase Details
Closed on
Jun 26, 2023
Sold by
Frey Beverly J
Bought by
Harper Je and Harper Pa
Purchase Details
Closed on
Feb 15, 1985
Sold by
Frey Robert E
Bought by
Frey Robert E and Frey Beverly J
Purchase Details
Closed on
Dec 8, 1976
Sold by
Frey Robert E
Bought by
Frey Robert E
Purchase Details
Closed on
Jan 1, 1975
Bought by
Frey Robert E
Create a Home Valuation Report for This Property
The Home Valuation Report is an in-depth analysis detailing your home's value as well as a comparison with similar homes in the area
Home Values in the Area
Average Home Value in this Area
Purchase History
| Date | Buyer | Sale Price | Title Company |
|---|---|---|---|
| Sonders Street Llc | -- | None Listed On Document | |
| Harper Je | -- | None Listed On Document | |
| Frey Robert E | -- | -- | |
| Frey Robert E | -- | -- | |
| Frey Robert E | -- | -- |
Source: Public Records
Tax History
| Year | Tax Paid | Tax Assessment Tax Assessment Total Assessment is a certain percentage of the fair market value that is determined by local assessors to be the total taxable value of land and additions on the property. | Land | Improvement |
|---|---|---|---|---|
| 2025 | $3,822 | $57,855 | $10,080 | $47,775 |
| 2024 | $3,318 | $57,855 | $10,080 | $47,775 |
| 2023 | $2,944 | $43,060 | $8,370 | $34,690 |
| 2022 | $2,910 | $43,050 | $8,365 | $34,685 |
| 2021 | $3,243 | $43,050 | $8,370 | $34,690 |
| 2020 | $3,226 | $39,870 | $7,740 | $32,130 |
| 2019 | $2,903 | $113,900 | $22,100 | $91,800 |
| 2018 | $2,880 | $39,870 | $7,740 | $32,130 |
| 2017 | $3,070 | $35,980 | $6,580 | $29,400 |
| 2016 | $3,077 | $35,980 | $6,580 | $29,400 |
| 2015 | $2,800 | $35,980 | $6,580 | $29,400 |
| 2014 | $2,800 | $35,980 | $6,580 | $29,400 |
Source: Public Records
Map
Nearby Homes
- 226 E 216th St
- 94 E 217th St
- 285 E 216th St
- 144 E 208th St
- 324 E 215th St
- 170 E 220th St
- 336 E 222nd St
- 273 E 208th St
- 421 Kenwood Dr Unit G
- 21051 S Lake Shore Blvd
- 461 Kenwood Dr Unit T3
- 450 Kenwood Dr Unit D-12
- 422 Clearview Dr Unit J10
- 291 E 204th St
- 71 E 201st St
- 22751 Fox Ave
- 21000 Crystal Ave
- 521 Kenwood Dr Unit B-5
- 442 Clearview Dr Unit U9
- 21670 Crystal Ave
- 170 E 213th St
- 164 E 213th St
- 21249 Lake Shore Blvd
- 21259 Lake Shore Blvd
- 21239 Lake Shore Blvd
- 175 E 212th St
- 171 E 212th St
- 165 E 212th St
- 154 E 213th St
- 21229 Lake Shore Blvd
- 175 E 213th St
- 21329 Lake Shore Blvd
- 161 E 212th St
- 171 E 213th St
- 165 E 213th St
- 21219 Lake Shore Blvd
- 155 E 212th St
- 161 E 213th St
- 21339 Lake Shore Blvd
- 155 E 213th St
Your Personal Tour Guide
Ask me questions while you tour the home.