174 E 700 N Logan, UT 84321
Adams NeighborhoodEstimated Value: $368,360 - $416,000
2
Beds
2
Baths
2,066
Sq Ft
$186/Sq Ft
Est. Value
About This Home
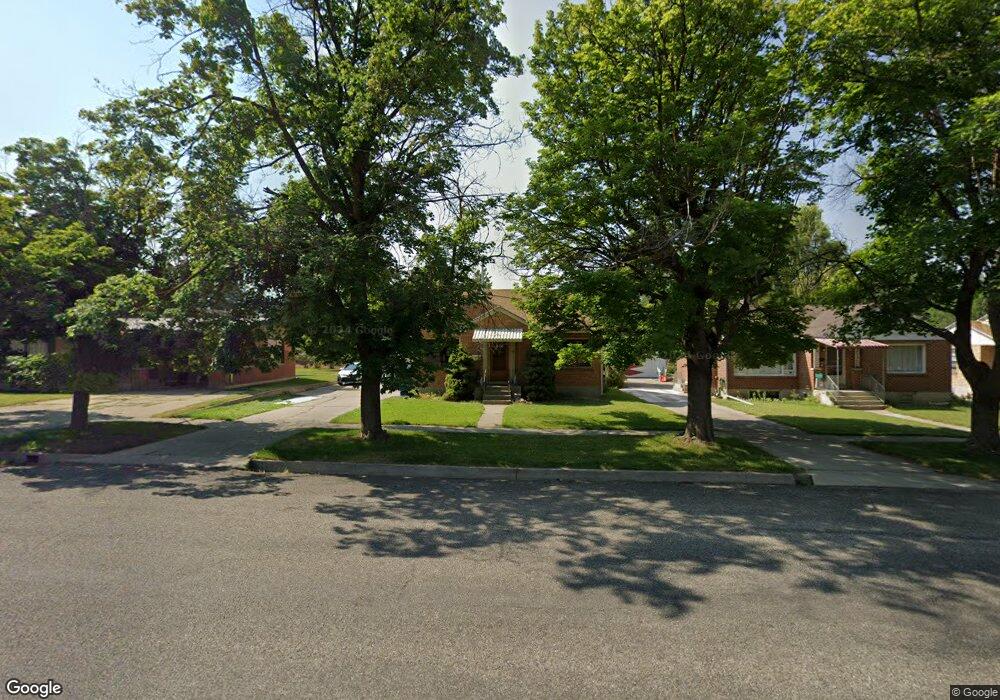
This home is located at 174 E 700 N, Logan, UT 84321 and is currently estimated at $384,340, approximately $186 per square foot. 174 E 700 N is a home located in Cache County with nearby schools including Adams Elementary School, Mount Logan Middle School, and Logan High School.
Ownership History
Date
Name
Owned For
Owner Type
Purchase Details
Closed on
Jan 6, 2026
Sold by
Mccombs Tosha and Meyers Cindy M
Bought by
Meyers Family Trust and Meyers
Current Estimated Value
Home Financials for this Owner
Home Financials are based on the most recent Mortgage that was taken out on this home.
Original Mortgage
$93,600
Outstanding Balance
$93,511
Interest Rate
6.23%
Mortgage Type
New Conventional
Estimated Equity
$290,829
Purchase Details
Closed on
Jan 5, 2026
Sold by
Mccombs Tosha and Meyers Cindy M
Bought by
Mccombs Tosha L and Meyers Roger L
Home Financials for this Owner
Home Financials are based on the most recent Mortgage that was taken out on this home.
Original Mortgage
$93,600
Outstanding Balance
$93,511
Interest Rate
6.23%
Mortgage Type
New Conventional
Estimated Equity
$290,829
Purchase Details
Closed on
Dec 23, 2025
Sold by
Mccombs Corey and Mccombs Tosha
Bought by
Meyers Family Trust and Meyers
Home Financials for this Owner
Home Financials are based on the most recent Mortgage that was taken out on this home.
Original Mortgage
$93,600
Outstanding Balance
$93,511
Interest Rate
6.23%
Mortgage Type
New Conventional
Estimated Equity
$290,829
Purchase Details
Closed on
Sep 25, 2017
Sold by
Mccombs Corey
Bought by
Mccombs Corey and Mccombs Tosha
Purchase Details
Closed on
Aug 22, 2017
Sold by
Bench Larry and Bench Julie
Bought by
Young Anne Kristine
Purchase Details
Closed on
May 1, 2015
Sold by
Bench Joyce M
Bought by
Bench Larry and Bench Julie
Purchase Details
Closed on
Apr 30, 2015
Sold by
Bench Joyce M and The Dean R Bench & Joyce M Ben
Bought by
Bench Larry and Bench Julie
Purchase Details
Closed on
Sep 7, 2012
Sold by
Bench Dean and Bench Joyce
Bought by
Young Anne Kristine
Home Financials for this Owner
Home Financials are based on the most recent Mortgage that was taken out on this home.
Original Mortgage
$135,500
Interest Rate
3.71%
Mortgage Type
Seller Take Back
Purchase Details
Closed on
Feb 10, 2005
Sold by
Bench Joyce
Bought by
Bench Dean R and Bench Joyce M
Create a Home Valuation Report for This Property
The Home Valuation Report is an in-depth analysis detailing your home's value as well as a comparison with similar homes in the area
Home Values in the Area
Average Home Value in this Area
Purchase History
| Date | Buyer | Sale Price | Title Company |
|---|---|---|---|
| Meyers Family Trust | -- | Hickman Land Title | |
| Mccombs Tosha L | -- | Hickman Land Title | |
| Meyers Family Trust | -- | Hickman Land Title | |
| Mccombs Corey | -- | Cache Title Co | |
| Mccombs Corey | -- | -- | |
| Young Anne Kristine | -- | Cache Title Company Inc | |
| Bench Larry | -- | Cache Title | |
| Bench Larry | -- | Cache Title | |
| Young Anne Kristine | $142,500 | American Secure Title | |
| Bench Dean R | -- | None Available | |
| Bench Dean R | -- | None Available | |
| Bench Dean R | -- | None Available |
Source: Public Records
Mortgage History
| Date | Status | Borrower | Loan Amount |
|---|---|---|---|
| Open | Mccombs Tosha L | $93,600 | |
| Previous Owner | Young Anne Kristine | $135,500 |
Source: Public Records
Tax History
| Year | Tax Paid | Tax Assessment Tax Assessment Total Assessment is a certain percentage of the fair market value that is determined by local assessors to be the total taxable value of land and additions on the property. | Land | Improvement |
|---|---|---|---|---|
| 2025 | $1,608 | $208,020 | $0 | $0 |
| 2023 | $1,734 | $207,030 | $0 | $0 |
| 2022 | $1,857 | $207,030 | $0 | $0 |
| 2021 | $149 | $257,160 | $45,000 | $212,160 |
| 2020 | $1,343 | $208,200 | $45,000 | $163,200 |
| 2019 | $1,404 | $208,200 | $45,000 | $163,200 |
| 2018 | $1,370 | $185,560 | $45,000 | $140,560 |
| 2017 | $1,310 | $93,775 | $0 | $0 |
| 2016 | $1,358 | $78,705 | $0 | $0 |
| 2015 | $1,141 | $78,705 | $0 | $0 |
| 2014 | $1,031 | $78,705 | $0 | $0 |
| 2013 | -- | $76,230 | $0 | $0 |
Source: Public Records
Map
Nearby Homes
Your Personal Tour Guide
Ask me questions while you tour the home.