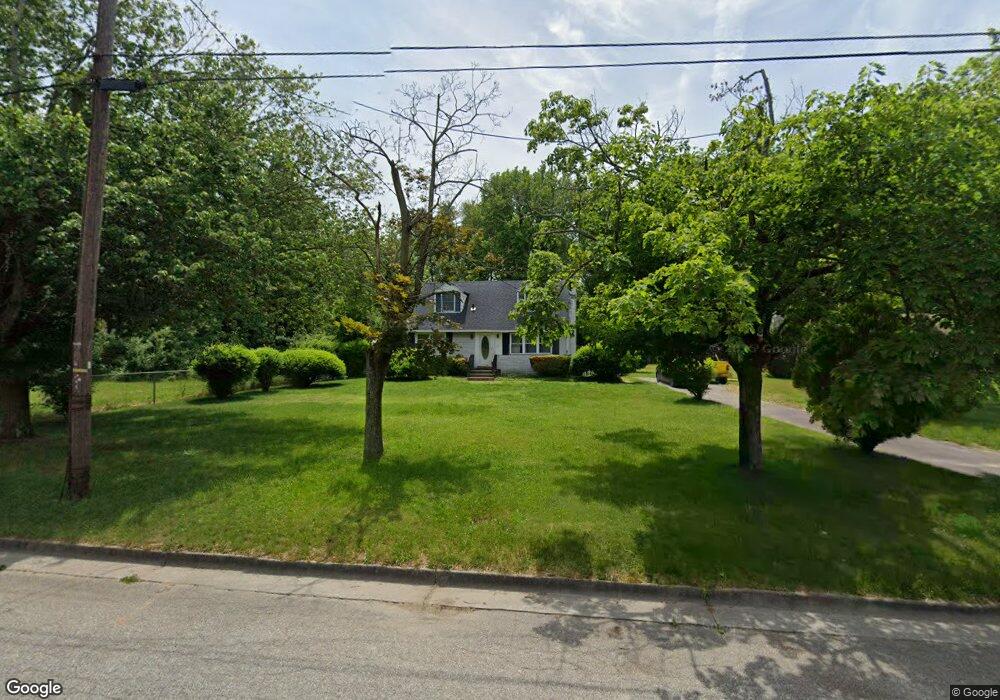
174 E Del a Vue Ave Penns Grove, NJ 08069
Estimated Value: $212,242 - $273,000
--
Bed
--
Bath
1,291
Sq Ft
$188/Sq Ft
Est. Value
About This Home
This home is located at 174 E Del a Vue Ave, Penns Grove, NJ 08069 and is currently estimated at $243,061, approximately $188 per square foot. 174 E Del a Vue Ave is a home located in Salem County with nearby schools including Lafayette-Pershing Elementary School, Field Street Elementary School, and Paul W. Carleton Elementary School.
Ownership History
Date
Name
Owned For
Owner Type
Purchase Details
Closed on
May 12, 2006
Sold by
Walsh Melinda C
Bought by
Walsh Douglas and Walsh Melinda C
Current Estimated Value
Home Financials for this Owner
Home Financials are based on the most recent Mortgage that was taken out on this home.
Original Mortgage
$140,000
Outstanding Balance
$81,175
Interest Rate
6.42%
Mortgage Type
New Conventional
Estimated Equity
$161,886
Purchase Details
Closed on
Nov 1, 2004
Sold by
Ransome Renee C
Bought by
Walsh Melinda C
Home Financials for this Owner
Home Financials are based on the most recent Mortgage that was taken out on this home.
Original Mortgage
$112,500
Interest Rate
5.63%
Mortgage Type
Purchase Money Mortgage
Purchase Details
Closed on
Mar 5, 1999
Sold by
Billings Darrell
Bought by
Brown Billings Renee C
Create a Home Valuation Report for This Property
The Home Valuation Report is an in-depth analysis detailing your home's value as well as a comparison with similar homes in the area
Home Values in the Area
Average Home Value in this Area
Purchase History
| Date | Buyer | Sale Price | Title Company |
|---|---|---|---|
| Walsh Douglas | -- | None Available | |
| Walsh Melinda C | $125,000 | -- | |
| Brown Billings Renee C | -- | -- |
Source: Public Records
Mortgage History
| Date | Status | Borrower | Loan Amount |
|---|---|---|---|
| Open | Walsh Douglas | $140,000 | |
| Closed | Walsh Melinda C | $112,500 |
Source: Public Records
Tax History Compared to Growth
Tax History
| Year | Tax Paid | Tax Assessment Tax Assessment Total Assessment is a certain percentage of the fair market value that is determined by local assessors to be the total taxable value of land and additions on the property. | Land | Improvement |
|---|---|---|---|---|
| 2025 | $4,295 | $229,200 | $62,400 | $166,800 |
| 2024 | $4,147 | $116,500 | $24,800 | $91,700 |
| 2023 | $4,147 | $116,500 | $24,800 | $91,700 |
| 2022 | $3,903 | $116,500 | $24,800 | $91,700 |
| 2021 | $3,639 | $116,500 | $24,800 | $91,700 |
| 2020 | $3,899 | $116,500 | $24,800 | $91,700 |
| 2019 | $3,932 | $116,500 | $24,800 | $91,700 |
| 2018 | $3,511 | $111,500 | $32,000 | $79,500 |
| 2017 | $3,274 | $111,500 | $32,000 | $79,500 |
| 2016 | $3,771 | $133,300 | $33,400 | $99,900 |
| 2015 | $3,595 | $133,300 | $33,400 | $99,900 |
| 2014 | $3,403 | $133,300 | $33,400 | $99,900 |
Source: Public Records
Map
Nearby Homes
- 111 Grove St
- 51 Washington Ave
- 142 N Dolbow Ave
- 279 Pine St
- 303 Pine St
- 311 Pine St
- 210 Penns Grove Auburn Rd
- 136 Penns Grove Auburn Rd
- 150 Penns Grove Auburn Rd
- 99 N Virginia Ave
- 27 E Line St
- 31 Elvin Ave
- 59 61 Broad St
- 28 4th Ave
- 113 N Broad St
- 81 7th Ave
- 18 Pearl St
- 6 W Griffith St
- 71 Poplar St
- 0 Cumberland Ave
- 178 E Del a Vue Ave
- 168 E Del a Vue Ave
- 184 E Del a Vue Ave
- 162 E Del a Vue Ave
- 167 E Del a Vue Ave
- 181 E Del a Vue Ave
- 163 E Del a Vue Ave
- 2 Gaventa St
- 185 E Del a Vue Ave
- 155 E Del a Vue Ave
- 196 E Del a Vue Ave
- 151 E Del a Vue Ave
- 146 E Del a Vue Ave
- 143 E Del a Vue Ave
- 138 E Del a Vue Ave
- 133 E Del a Vue Ave
- 130 E Del a Vue Ave
- 129 E Del a Vue Ave
- 155 Johnson Ave
- 126 E Del a Vue Ave