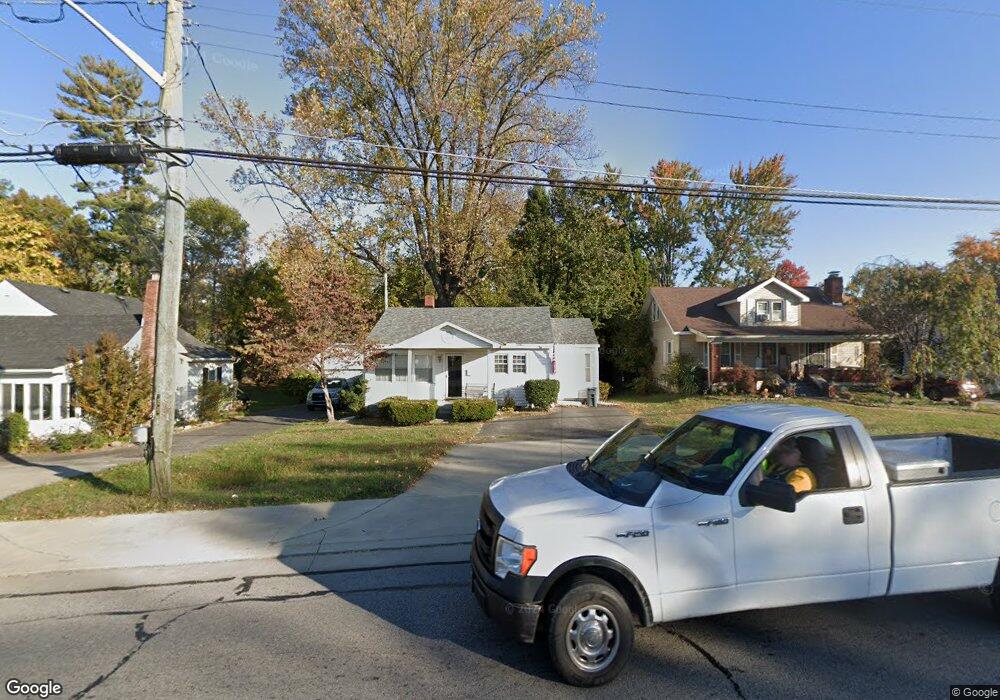
174 E Main St Austin, IN 47102
Estimated Value: $123,812 - $144,000
2
Beds
1
Bath
880
Sq Ft
$150/Sq Ft
Est. Value
About This Home
This home is located at 174 E Main St, Austin, IN 47102 and is currently estimated at $132,203, approximately $150 per square foot. 174 E Main St is a home located in Scott County with nearby schools including Austin Elementary School, Austin Middle School, and Austin High School.
Ownership History
Date
Name
Owned For
Owner Type
Purchase Details
Closed on
Mar 5, 2018
Sold by
Riley Lillie
Bought by
Hollan Kelly
Current Estimated Value
Home Financials for this Owner
Home Financials are based on the most recent Mortgage that was taken out on this home.
Original Mortgage
$42,000
Outstanding Balance
$35,388
Interest Rate
4.15%
Mortgage Type
New Conventional
Estimated Equity
$96,815
Purchase Details
Closed on
Aug 20, 2012
Sold by
Riley Lillie
Bought by
State Of Indiana
Create a Home Valuation Report for This Property
The Home Valuation Report is an in-depth analysis detailing your home's value as well as a comparison with similar homes in the area
Home Values in the Area
Average Home Value in this Area
Purchase History
| Date | Buyer | Sale Price | Title Company |
|---|---|---|---|
| Hollan Kelly | -- | Lagacy Title Company Llc | |
| State Of Indiana | $12,810 | None Available | |
| -- | $3,445 | Rws South, Inc. |
Source: Public Records
Mortgage History
| Date | Status | Borrower | Loan Amount |
|---|---|---|---|
| Open | Hollan Kelly | $42,000 |
Source: Public Records
Tax History
| Year | Tax Paid | Tax Assessment Tax Assessment Total Assessment is a certain percentage of the fair market value that is determined by local assessors to be the total taxable value of land and additions on the property. | Land | Improvement |
|---|---|---|---|---|
| 2025 | $680 | $89,200 | $16,000 | $73,200 |
| 2024 | $680 | $79,600 | $16,000 | $63,600 |
| 2023 | $654 | $80,000 | $16,000 | $64,000 |
| 2022 | $639 | $81,500 | $16,000 | $65,500 |
| 2021 | $492 | $73,300 | $16,000 | $57,300 |
| 2020 | $481 | $69,300 | $16,000 | $53,300 |
| 2019 | $220 | $38,900 | $6,500 | $32,400 |
| 2018 | $229 | $40,800 | $6,500 | $34,300 |
| 2017 | $219 | $40,900 | $6,500 | $34,400 |
| 2016 | $208 | $39,200 | $6,500 | $32,700 |
| 2014 | $225 | $40,900 | $7,700 | $33,200 |
| 2013 | $225 | $34,300 | $7,700 | $26,600 |
Source: Public Records
Map
Nearby Homes
Your Personal Tour Guide
Ask me questions while you tour the home.