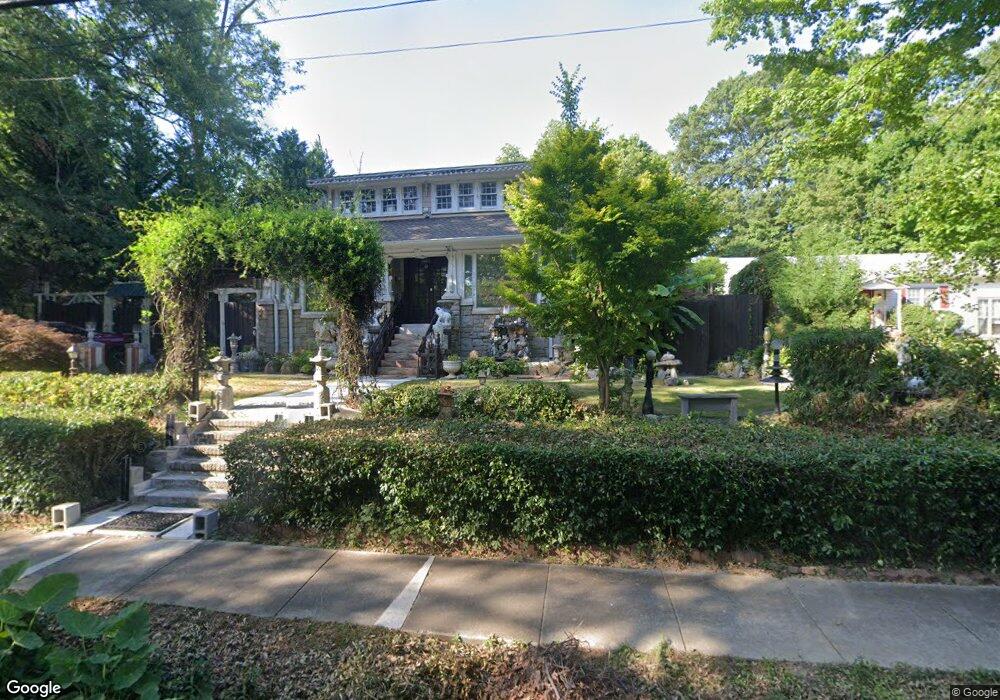
174 Holcomb Bridge Rd Norcross, GA 30071
Estimated Value: $511,690 - $606,000
3
Beds
1
Bath
2,498
Sq Ft
$218/Sq Ft
Est. Value
About This Home
This home is located at 174 Holcomb Bridge Rd, Norcross, GA 30071 and is currently estimated at $544,423, approximately $217 per square foot. 174 Holcomb Bridge Rd is a home with nearby schools including Norcross Elementary School, Summerour Middle School, and Paul Duke STEM High School.
Ownership History
Date
Name
Owned For
Owner Type
Purchase Details
Closed on
Mar 15, 2016
Sold by
Vo Andrew
Bought by
Vo Andrew and Vo Tina
Current Estimated Value
Purchase Details
Closed on
Oct 14, 2010
Sold by
Vo Andrew and Vo Tina
Bought by
Vo Andrew
Purchase Details
Closed on
Jul 10, 2007
Sold by
Vo Andrew
Bought by
Vo Andrew and Vo Tina
Home Financials for this Owner
Home Financials are based on the most recent Mortgage that was taken out on this home.
Original Mortgage
$193,500
Interest Rate
6.37%
Mortgage Type
New Conventional
Create a Home Valuation Report for This Property
The Home Valuation Report is an in-depth analysis detailing your home's value as well as a comparison with similar homes in the area
Home Values in the Area
Average Home Value in this Area
Purchase History
| Date | Buyer | Sale Price | Title Company |
|---|---|---|---|
| Vo Andrew | -- | -- | |
| Vo Andrew | -- | -- | |
| Vo Andrew | -- | -- | |
| Vo Andrew | $193,500 | -- |
Source: Public Records
Mortgage History
| Date | Status | Borrower | Loan Amount |
|---|---|---|---|
| Previous Owner | Vo Andrew | $193,500 |
Source: Public Records
Tax History Compared to Growth
Tax History
| Year | Tax Paid | Tax Assessment Tax Assessment Total Assessment is a certain percentage of the fair market value that is determined by local assessors to be the total taxable value of land and additions on the property. | Land | Improvement |
|---|---|---|---|---|
| 2025 | -- | $192,800 | $38,000 | $154,800 |
| 2024 | $2,934 | $128,240 | $50,000 | $78,240 |
| 2023 | $2,934 | $133,120 | $37,600 | $95,520 |
| 2022 | $2,568 | $109,920 | $34,000 | $75,920 |
| 2021 | $2,367 | $96,960 | $26,720 | $70,240 |
| 2020 | $2,391 | $96,960 | $26,720 | $70,240 |
| 2019 | $3,390 | $101,960 | $24,000 | $77,960 |
| 2018 | $2,077 | $82,040 | $24,000 | $58,040 |
| 2016 | $2,083 | $82,040 | $24,000 | $58,040 |
| 2015 | $2,371 | $68,280 | $20,000 | $48,280 |
| 2014 | $1,545 | $56,320 | $20,000 | $36,320 |
Source: Public Records
Map
Nearby Homes
- 90 W Peachtree St
- 479 Holcomb Bridge Rd
- 186 Wingo St
- 231 Sunset Hills Dr
- 204 Wingo St
- 519 Holcomb Bridge Rd
- 482 Nesbit St
- 6000 Hunter Hall Ct
- 435 Webb Dr
- 5766 Buford Hwy
- 53AND63 Born St
- 63 Born St NW
- 453 Hunter St
- 267 Longview Dr
- 53 Born St
- 695 Holcomb Bridge Rd
- 5596 Buford Hwy
- 757 Sunset Dr
- 505 Cochran Dr
- 782 Holcomb Bridge Rd
- 156 Holcomb Bridge Rd
- 81 S Barton St
- 84 W Peachtree St
- 66 W Peachtree St
- 155 Holcomb Bridge Rd
- 53 S Barton St
- 167 Holcomb Bridge Rd
- 46 W Peachtree St
- 189 Holcomb Bridge Rd
- 145 Holcomb Bridge Rd
- 211 Holcomb Bridge Rd
- 114 W Peachtree St
- 78 S Barton St
- 62 S Barton St
- 197 Park Dr
- 91 Holcomb Bridge Rd
- 34 S Barton St
- 233 Holcomb Bridge Rd
- 240 W Peachtree St
- 79 W Peachtree St