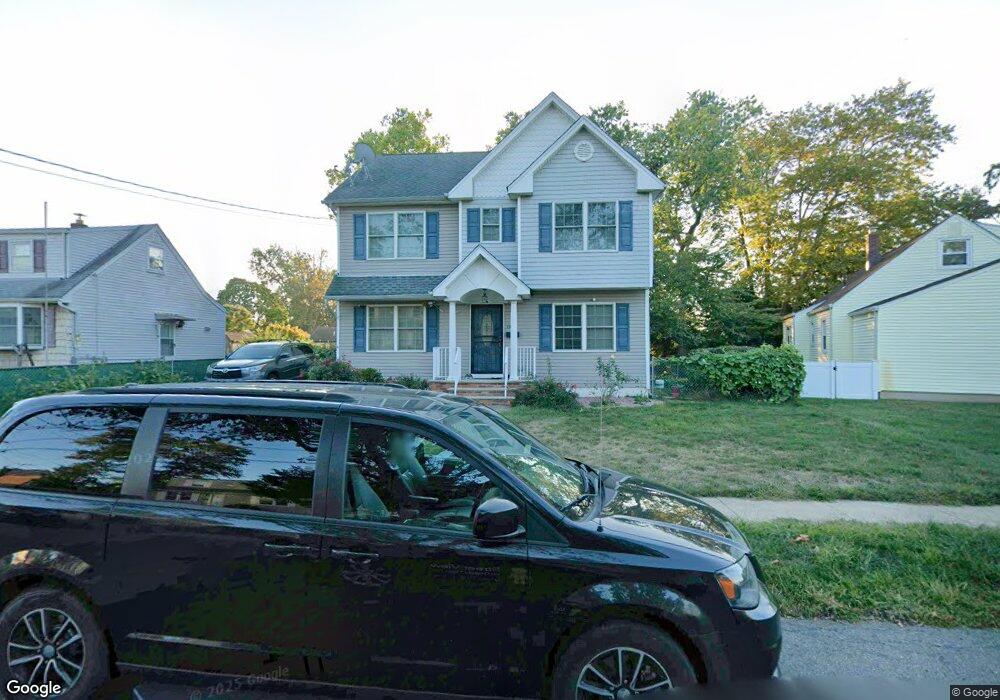
174 Loring Ave Edison, NJ 08817
Estimated Value: $676,268 - $813,000
4
Beds
3
Baths
1,824
Sq Ft
$400/Sq Ft
Est. Value
About This Home
This home is located at 174 Loring Ave, Edison, NJ 08817 and is currently estimated at $730,067, approximately $400 per square foot. 174 Loring Ave is a home located in Middlesex County with nearby schools including Lindeneau Elementary School, Thomas Jefferson Middle School, and Edison High School.
Ownership History
Date
Name
Owned For
Owner Type
Purchase Details
Closed on
Aug 17, 2018
Sold by
Veeramallu Subhashini and Suragana Sarath
Bought by
Patel Bharatkumar P and Patel Sangitaben B
Current Estimated Value
Home Financials for this Owner
Home Financials are based on the most recent Mortgage that was taken out on this home.
Original Mortgage
$364,000
Outstanding Balance
$316,119
Interest Rate
4.5%
Mortgage Type
New Conventional
Estimated Equity
$413,948
Purchase Details
Closed on
Apr 3, 2008
Sold by
Dudas Mary
Bought by
Ziskoski David
Home Financials for this Owner
Home Financials are based on the most recent Mortgage that was taken out on this home.
Original Mortgage
$180,000
Interest Rate
5.99%
Mortgage Type
Negative Amortization
Create a Home Valuation Report for This Property
The Home Valuation Report is an in-depth analysis detailing your home's value as well as a comparison with similar homes in the area
Home Values in the Area
Average Home Value in this Area
Purchase History
| Date | Buyer | Sale Price | Title Company |
|---|---|---|---|
| Patel Bharatkumar P | $455,000 | American Land Title Associat | |
| Ziskoski David | $225,000 | Premier Abstract & Title Age |
Source: Public Records
Mortgage History
| Date | Status | Borrower | Loan Amount |
|---|---|---|---|
| Open | Patel Bharatkumar P | $364,000 | |
| Previous Owner | Ziskoski David | $180,000 |
Source: Public Records
Tax History
| Year | Tax Paid | Tax Assessment Tax Assessment Total Assessment is a certain percentage of the fair market value that is determined by local assessors to be the total taxable value of land and additions on the property. | Land | Improvement |
|---|---|---|---|---|
| 2025 | $11,376 | $191,100 | $80,500 | $110,600 |
| 2024 | $11,315 | $191,100 | $80,500 | $110,600 |
| 2023 | $11,315 | $191,100 | $80,500 | $110,600 |
| 2022 | $11,319 | $191,100 | $80,500 | $110,600 |
| 2021 | $11,281 | $191,100 | $80,500 | $110,600 |
| 2020 | $11,177 | $191,100 | $80,500 | $110,600 |
| 2019 | $10,755 | $191,100 | $80,500 | $110,600 |
| 2018 | $10,495 | $191,100 | $80,500 | $110,600 |
| 2017 | $10,274 | $191,100 | $80,500 | $110,600 |
| 2016 | $10,082 | $191,100 | $80,500 | $110,600 |
| 2015 | $9,696 | $191,100 | $80,500 | $110,600 |
| 2014 | $9,414 | $191,100 | $80,500 | $110,600 |
Source: Public Records
Map
Nearby Homes
Your Personal Tour Guide
Ask me questions while you tour the home.