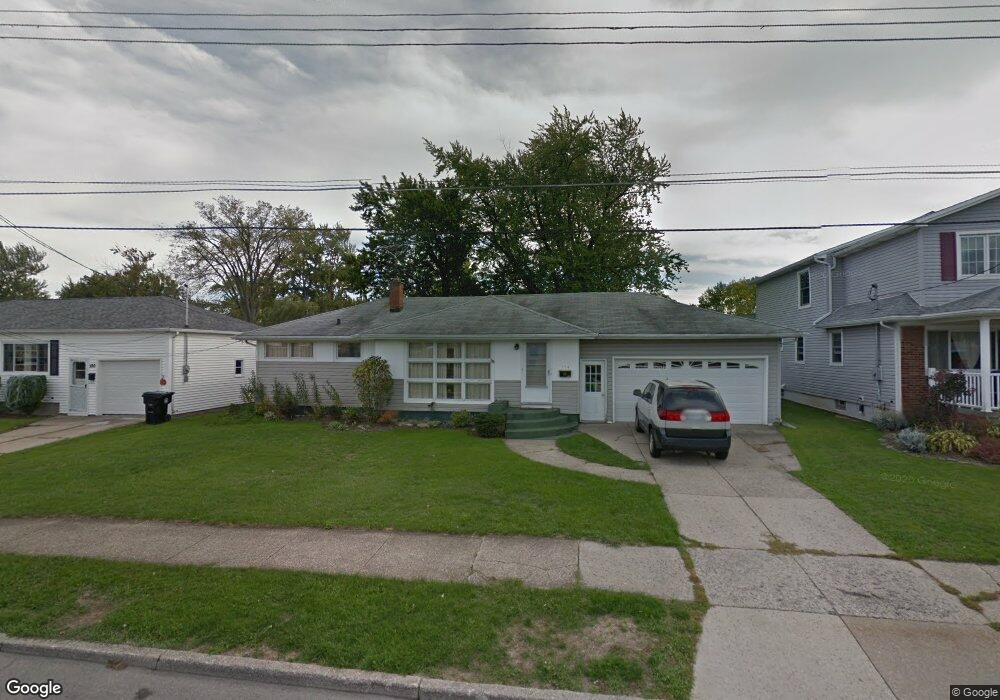
174 Mullen St Tonawanda, NY 14150
Estimated Value: $224,000 - $238,477
3
Beds
1
Bath
960
Sq Ft
$241/Sq Ft
Est. Value
About This Home
This home is located at 174 Mullen St, Tonawanda, NY 14150 and is currently estimated at $231,369, approximately $241 per square foot. 174 Mullen St is a home located in Erie County with nearby schools including Mullen Elementary School, Tonawanda Elementary School, and Tonawanda Middle High School.
Ownership History
Date
Name
Owned For
Owner Type
Purchase Details
Closed on
May 26, 2023
Sold by
Swagel Stephen M and Estate Of Draga Swagel
Bought by
Adamo Andrew and Swagel Kelli
Current Estimated Value
Home Financials for this Owner
Home Financials are based on the most recent Mortgage that was taken out on this home.
Original Mortgage
$92,861
Outstanding Balance
$90,378
Interest Rate
6.39%
Mortgage Type
New Conventional
Estimated Equity
$140,991
Purchase Details
Closed on
Apr 18, 2001
Sold by
Blum John D and Blum Jennifer J
Bought by
Swagel Stephen M
Create a Home Valuation Report for This Property
The Home Valuation Report is an in-depth analysis detailing your home's value as well as a comparison with similar homes in the area
Home Values in the Area
Average Home Value in this Area
Purchase History
| Date | Buyer | Sale Price | Title Company |
|---|---|---|---|
| Adamo Andrew | $185,400 | None Available | |
| Swagel Stephen M | $61,000 | -- |
Source: Public Records
Mortgage History
| Date | Status | Borrower | Loan Amount |
|---|---|---|---|
| Open | Adamo Andrew | $92,861 |
Source: Public Records
Tax History Compared to Growth
Tax History
| Year | Tax Paid | Tax Assessment Tax Assessment Total Assessment is a certain percentage of the fair market value that is determined by local assessors to be the total taxable value of land and additions on the property. | Land | Improvement |
|---|---|---|---|---|
| 2024 | $2,750 | $182,000 | $18,900 | $163,100 |
| 2023 | $2,632 | $182,000 | $18,900 | $163,100 |
| 2022 | $2,424 | $109,000 | $19,800 | $89,200 |
| 2021 | $2,415 | $109,000 | $19,800 | $89,200 |
| 2020 | $2,387 | $109,000 | $19,800 | $89,200 |
| 2019 | $2,992 | $109,000 | $19,800 | $89,200 |
| 2018 | $2,325 | $109,000 | $19,800 | $89,200 |
| 2017 | $551 | $91,000 | $19,800 | $71,200 |
| 2016 | $1,013 | $91,000 | $19,800 | $71,200 |
| 2015 | -- | $91,000 | $19,800 | $71,200 |
| 2014 | -- | $91,000 | $19,800 | $71,200 |
Source: Public Records
Map
Nearby Homes