174 N 700 W Layton, UT 84041
Estimated Value: $451,000 - $501,000
3
Beds
2
Baths
2,240
Sq Ft
$215/Sq Ft
Est. Value
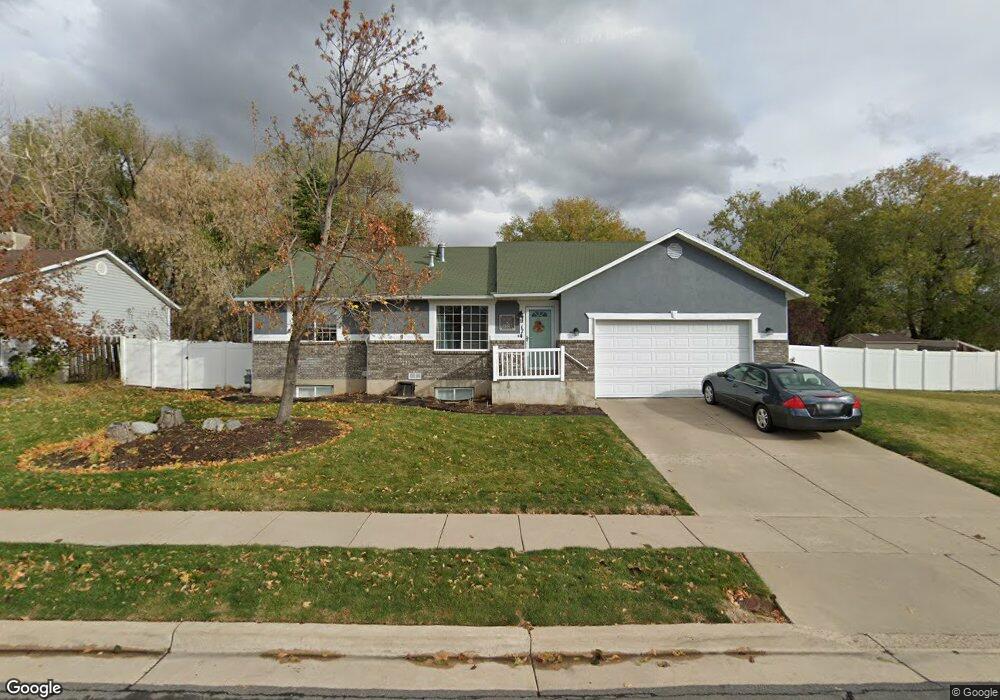
About This Home
This home is located at 174 N 700 W, Layton, UT 84041 and is currently estimated at $481,813, approximately $215 per square foot. 174 N 700 W is a home located in Davis County with nearby schools including Layton Elementary School, Fairfield Junior High School, and Layton High School.
Ownership History
Date
Name
Owned For
Owner Type
Purchase Details
Closed on
May 23, 2003
Sold by
Strong Quin L and Strong Kirsten B
Bought by
Tureson Michael and Tureson Jamie
Current Estimated Value
Home Financials for this Owner
Home Financials are based on the most recent Mortgage that was taken out on this home.
Original Mortgage
$151,460
Outstanding Balance
$65,444
Interest Rate
5.71%
Mortgage Type
FHA
Estimated Equity
$416,369
Purchase Details
Closed on
Oct 7, 1997
Sold by
Derby Construction Llc
Bought by
Strong Quin L and Strong Kirsten B
Purchase Details
Closed on
Jun 17, 1997
Sold by
Derby Construction
Bought by
Strong Quin L and Strong Kirsten B
Home Financials for this Owner
Home Financials are based on the most recent Mortgage that was taken out on this home.
Original Mortgage
$118,957
Interest Rate
7.94%
Mortgage Type
FHA
Create a Home Valuation Report for This Property
The Home Valuation Report is an in-depth analysis detailing your home's value as well as a comparison with similar homes in the area
Home Values in the Area
Average Home Value in this Area
Purchase History
| Date | Buyer | Sale Price | Title Company |
|---|---|---|---|
| Tureson Michael | -- | Backman Stewart Title Servic | |
| Strong Quin L | -- | American Legal Title Ins | |
| Strong Quin L | -- | American Legal Title Ins Age |
Source: Public Records
Mortgage History
| Date | Status | Borrower | Loan Amount |
|---|---|---|---|
| Open | Tureson Michael | $151,460 | |
| Previous Owner | Strong Quin L | $118,957 |
Source: Public Records
Tax History Compared to Growth
Tax History
| Year | Tax Paid | Tax Assessment Tax Assessment Total Assessment is a certain percentage of the fair market value that is determined by local assessors to be the total taxable value of land and additions on the property. | Land | Improvement |
|---|---|---|---|---|
| 2025 | $2,290 | $240,350 | $116,692 | $123,658 |
| 2024 | $2,221 | $234,850 | $127,857 | $106,993 |
| 2023 | $2,060 | $384,000 | $128,980 | $255,020 |
| 2022 | $2,244 | $227,150 | $79,000 | $148,150 |
| 2021 | $2,093 | $316,000 | $118,514 | $197,486 |
| 2020 | $1,899 | $275,000 | $100,136 | $174,864 |
| 2019 | $1,854 | $263,000 | $101,792 | $161,208 |
| 2018 | $1,678 | $239,000 | $89,384 | $149,616 |
| 2016 | $1,340 | $98,395 | $35,600 | $62,795 |
| 2015 | $1,230 | $85,745 | $35,600 | $50,145 |
| 2014 | $1,433 | $102,140 | $35,600 | $66,540 |
| 2013 | -- | $89,979 | $28,952 | $61,027 |
Source: Public Records
Map
Nearby Homes
- 750 W Gentile St
- 485 W 100 N
- 526 King St Unit 2
- 933 W Gentile St
- 356 W 25 N
- 355 W Gentile St
- 6 Grover St
- 362 S 950 W
- 267 S Melody St
- 1015 W 350 S
- 495 Spurlock St
- 1113 W Angel Hill Ct
- 174 W Dawson St
- 480 Spurlock St
- 1677 N 1600 W Unit 134
- 441 Church St
- 142 Green Dr
- 298 Amber Ln
- 316 Amber Ln
- Browning Plan at Amber Fields