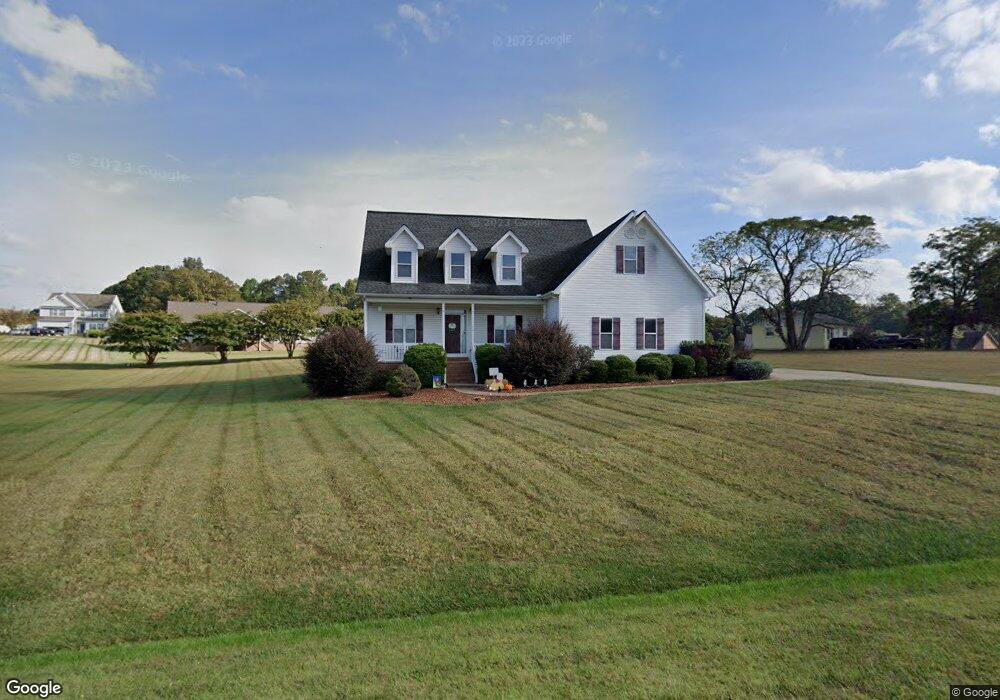
174 Pear Tree Rd Troutman, NC 28166
Estimated Value: $350,000 - $416,000
3
Beds
3
Baths
1,864
Sq Ft
$209/Sq Ft
Est. Value
About This Home
This home is located at 174 Pear Tree Rd, Troutman, NC 28166 and is currently estimated at $389,761, approximately $209 per square foot. 174 Pear Tree Rd is a home located in Iredell County with nearby schools including Troutman Elementary School, Troutman Middle School, and South Iredell High School.
Ownership History
Date
Name
Owned For
Owner Type
Purchase Details
Closed on
Feb 23, 2007
Sold by
Butler Richard L and Butler Kimberly D
Bought by
Spinelli Peter M and Spinelli Melissa C
Current Estimated Value
Home Financials for this Owner
Home Financials are based on the most recent Mortgage that was taken out on this home.
Original Mortgage
$165,280
Outstanding Balance
$98,048
Interest Rate
6.17%
Mortgage Type
Purchase Money Mortgage
Estimated Equity
$291,713
Purchase Details
Closed on
Oct 18, 2005
Sold by
Kelly W Keith and Kelly Peggy R
Bought by
Butler Richard L and Butler Kimberly D
Home Financials for this Owner
Home Financials are based on the most recent Mortgage that was taken out on this home.
Original Mortgage
$116,350
Interest Rate
5.66%
Mortgage Type
Construction
Purchase Details
Closed on
Feb 1, 1986
Create a Home Valuation Report for This Property
The Home Valuation Report is an in-depth analysis detailing your home's value as well as a comparison with similar homes in the area
Home Values in the Area
Average Home Value in this Area
Purchase History
| Date | Buyer | Sale Price | Title Company |
|---|---|---|---|
| Spinelli Peter M | $207,000 | None Available | |
| Butler Richard L | $21,500 | Bb&T | |
| -- | -- | -- |
Source: Public Records
Mortgage History
| Date | Status | Borrower | Loan Amount |
|---|---|---|---|
| Open | Spinelli Peter M | $165,280 | |
| Previous Owner | Butler Richard L | $116,350 |
Source: Public Records
Tax History
| Year | Tax Paid | Tax Assessment Tax Assessment Total Assessment is a certain percentage of the fair market value that is determined by local assessors to be the total taxable value of land and additions on the property. | Land | Improvement |
|---|---|---|---|---|
| 2025 | $1,644 | $264,070 | $47,500 | $216,570 |
| 2024 | $1,644 | $264,070 | $47,500 | $216,570 |
| 2023 | $1,644 | $264,070 | $47,500 | $216,570 |
| 2022 | $1,448 | $217,740 | $34,680 | $183,060 |
| 2021 | $1,422 | $217,740 | $34,680 | $183,060 |
| 2020 | $1,422 | $217,740 | $34,680 | $183,060 |
| 2019 | $1,368 | $217,740 | $34,680 | $183,060 |
| 2018 | $1,265 | $202,970 | $34,680 | $168,290 |
| 2017 | $1,265 | $202,970 | $34,680 | $168,290 |
| 2016 | $1,265 | $202,970 | $34,680 | $168,290 |
| 2015 | $1,265 | $202,970 | $34,680 | $168,290 |
| 2014 | $1,186 | $206,230 | $33,250 | $172,980 |
Source: Public Records
Map
Nearby Homes
- 116 Holly Springs Loop
- 173 Painted Bunting Dr
- 118 Horton Dr
- 125 Apple Tree Ln Unit 15-16
- 105 Apple Tree Ln Unit 12
- 0 Hoover Rd
- 551 Perry Rd
- 129-131 Shermill Ln
- 505 Cedar St
- 340 Field Dr
- 214 Astor St
- 213 Cassius Dr
- 236 Cassius Dr
- 131 Autumn Leaf Rd
- 432 S Main St
- 228 Cassius Dr
- Dickenson Plan at Winecoff Village
- 210 Astor St
- 224 Cassius Dr
- Whitman Plan at Winecoff Village
- 180 Pear Tree Rd
- 180 Pear Tree Rd Unit 39
- 165 Gray Barn Dr
- L54 Fieldhaven Place
- L50 Fieldhaven Place
- L52 Fieldhaven Place
- L46 Fieldhaven Place
- L34 Fieldhaven Place
- L34 Fieldhaven Place Unit L34
- 162 Pear Tree Rd
- 175 Gray Barn Dr
- 157 Gray Barn Dr Unit 36
- 157 Gray Barn Dr
- L45 Fieldhaven Place
- L55 Fieldhaven Place
- L49 Fieldhaven Place
- L47 Fieldhaven Place
- L52,55 Fieldhaven Place
- 192 Fieldhaven Place
- 172 Gray Barn Dr