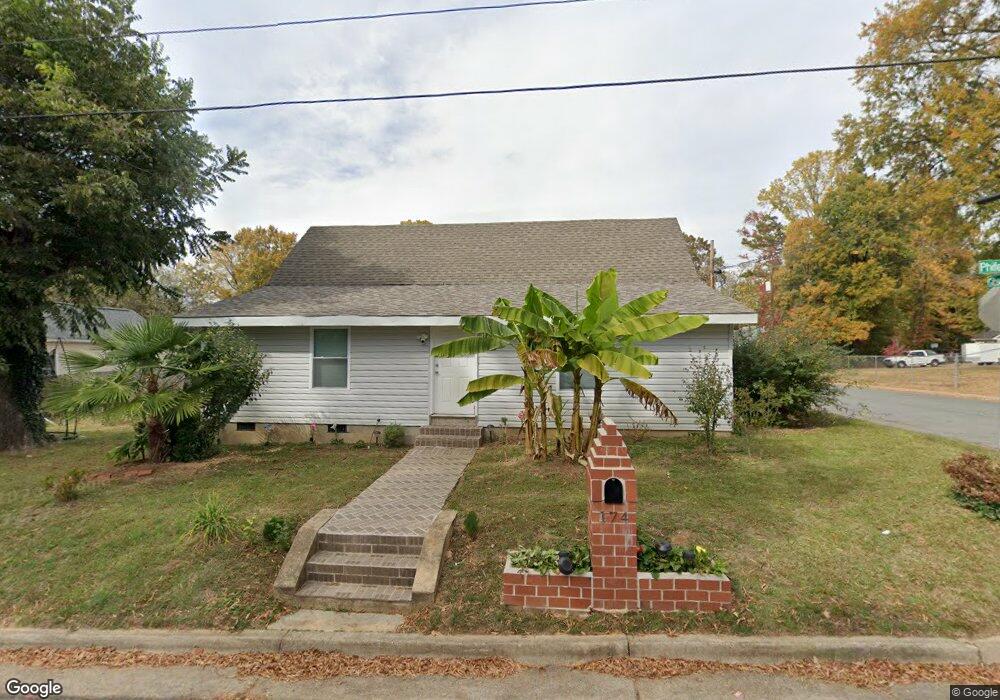
174 Phifer Ave NW Concord, NC 28025
Estimated Value: $251,000 - $302,000
3
Beds
1
Bath
1,590
Sq Ft
$172/Sq Ft
Est. Value
About This Home
This home is located at 174 Phifer Ave NW, Concord, NC 28025 and is currently estimated at $273,065, approximately $171 per square foot. 174 Phifer Ave NW is a home located in Cabarrus County with nearby schools including Beverly Hills STEM Elementary, Concord Middle School, and Concord High School.
Ownership History
Date
Name
Owned For
Owner Type
Purchase Details
Closed on
Oct 27, 2022
Sold by
Campechano Amado
Bought by
Dominguez Gonzalo Campechano and Salinas Socorro Noyola
Current Estimated Value
Purchase Details
Closed on
Jul 27, 2001
Sold by
Pawaroo Vidyanand and Shiwnandan Randy
Bought by
Campechano Amado
Home Financials for this Owner
Home Financials are based on the most recent Mortgage that was taken out on this home.
Original Mortgage
$72,327
Interest Rate
7.08%
Mortgage Type
FHA
Purchase Details
Closed on
Mar 8, 2001
Sold by
Young Dorethea V
Bought by
Pawaroo Vidyanand and Shiwnandan Randy
Home Financials for this Owner
Home Financials are based on the most recent Mortgage that was taken out on this home.
Original Mortgage
$44,000
Interest Rate
7.12%
Purchase Details
Closed on
Jun 1, 1983
Bought by
Young Charles L and Young Dorethea
Create a Home Valuation Report for This Property
The Home Valuation Report is an in-depth analysis detailing your home's value as well as a comparison with similar homes in the area
Home Values in the Area
Average Home Value in this Area
Purchase History
| Date | Buyer | Sale Price | Title Company |
|---|---|---|---|
| Dominguez Gonzalo Campechano | -- | -- | |
| Dominguez Gonzalo Campechano | -- | None Listed On Document | |
| Campechano Amado | $73,000 | -- | |
| Pawaroo Vidyanand | $33,000 | -- | |
| Young Charles L | -- | -- |
Source: Public Records
Mortgage History
| Date | Status | Borrower | Loan Amount |
|---|---|---|---|
| Previous Owner | Campechano Amado | $72,327 | |
| Previous Owner | Pawaroo Vidyanand | $44,000 |
Source: Public Records
Tax History Compared to Growth
Tax History
| Year | Tax Paid | Tax Assessment Tax Assessment Total Assessment is a certain percentage of the fair market value that is determined by local assessors to be the total taxable value of land and additions on the property. | Land | Improvement |
|---|---|---|---|---|
| 2025 | $2,515 | $252,510 | $58,000 | $194,510 |
| 2024 | $2,515 | $252,510 | $58,000 | $194,510 |
| 2023 | $1,849 | $151,540 | $26,000 | $125,540 |
| 2022 | $1,463 | $119,930 | $26,000 | $93,930 |
| 2021 | $1,463 | $119,930 | $26,000 | $93,930 |
| 2020 | $1,358 | $111,290 | $26,000 | $85,290 |
| 2019 | $1,079 | $88,460 | $16,000 | $72,460 |
| 2018 | $1,062 | $88,460 | $16,000 | $72,460 |
| 2017 | $1,033 | $87,510 | $16,000 | $71,510 |
| 2016 | $613 | $87,300 | $19,000 | $68,300 |
| 2015 | $1,002 | $87,300 | $19,000 | $68,300 |
| 2014 | $1,002 | $87,300 | $19,000 | $68,300 |
Source: Public Records
Map
Nearby Homes
- 152 Phifer Ave NW
- 158 Spencer Ave NW
- 636 Forest St NW
- 584 Allison St NW
- 590 Harris St NW
- 101 Todd Dr NW
- 722 Wilmar St NW
- 528 Gibson Dr NW
- 524 Railroad Dr NW
- 172 Brookwood Ave NW
- 604 Central Dr NW
- 480 Harris St NW
- 355 Camden Ct NW
- 69 Lake Dr NW
- 63 Brookwood Ave NW
- 169 Freeze Ave NW
- 19 Todd Dr NE
- 452 Harris St NW
- 383 Camden Ct NW
- 322 Gurley Dr NW
- 182 Phifer Ave NW
- 683 Gibson Dr NW
- 687 Gibson Dr NW
- 665 Gibson Dr NW
- 196 Phifer Ave NW
- 181 Phifer Ave NW
- 688 Harris St NW
- 692 Harris St NW
- 165 Phifer Ave NW
- 676 Harris St NW
- 691 Gibson Dr NW
- 690 Gibson Dr NW
- 153 Phifer Ave NW
- 698 Harris St NW
- 657 Gibson Dr NW
- 148 Phifer Ave NW
- 672 Harris St NW
- 684 Gibson Dr NW
- 693 Gibson Dr NW
- 88 Phifer Ave NW