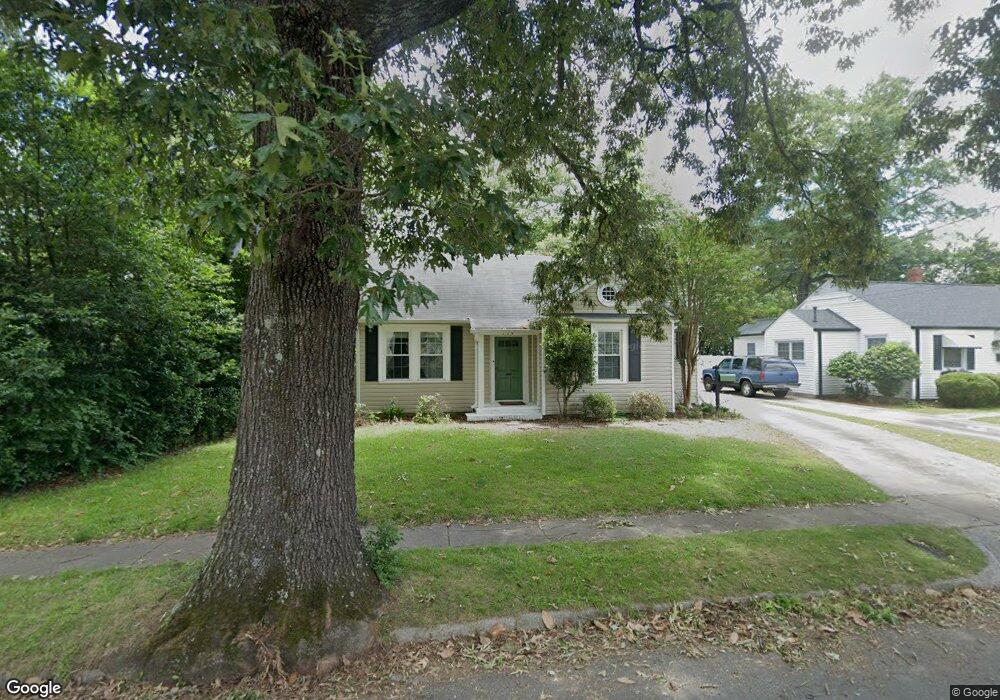
174 Rest Haven Ave Macon, GA 31204
Estimated Value: $141,000 - $182,000
2
Beds
2
Baths
1,378
Sq Ft
$112/Sq Ft
Est. Value
About This Home
This home is located at 174 Rest Haven Ave, Macon, GA 31204 and is currently estimated at $154,935, approximately $112 per square foot. 174 Rest Haven Ave is a home located in Bibb County with nearby schools including Rosa Taylor Elementary School, Miller Fine Arts Magnet Middle School, and Central High School.
Ownership History
Date
Name
Owned For
Owner Type
Purchase Details
Closed on
Oct 14, 2025
Sold by
Haysfam Llc
Bought by
Dmb Acquisitions Llc
Current Estimated Value
Home Financials for this Owner
Home Financials are based on the most recent Mortgage that was taken out on this home.
Original Mortgage
$119,160
Outstanding Balance
$118,835
Interest Rate
6.5%
Mortgage Type
New Conventional
Estimated Equity
$36,100
Purchase Details
Closed on
Mar 16, 2023
Sold by
Gatah Llc
Bought by
Marshland Investments Llc
Home Financials for this Owner
Home Financials are based on the most recent Mortgage that was taken out on this home.
Original Mortgage
$500,000
Interest Rate
6.09%
Mortgage Type
New Conventional
Purchase Details
Closed on
Dec 17, 2021
Sold by
Hays James C
Bought by
Haysfam Llc
Purchase Details
Closed on
Apr 8, 2005
Sold by
Swann Ruth J and Stewart Ruth J
Bought by
Hays James C
Home Financials for this Owner
Home Financials are based on the most recent Mortgage that was taken out on this home.
Original Mortgage
$121,000
Interest Rate
5.62%
Mortgage Type
New Conventional
Purchase Details
Closed on
Nov 27, 2002
Purchase Details
Closed on
Mar 29, 2001
Create a Home Valuation Report for This Property
The Home Valuation Report is an in-depth analysis detailing your home's value as well as a comparison with similar homes in the area
Purchase History
| Date | Buyer | Sale Price | Title Company |
|---|---|---|---|
| Dmb Acquisitions Llc | $148,950 | None Listed On Document | |
| Marshland Investments Llc | $120,000 | -- | |
| Haysfam Llc | -- | None Available | |
| Hays James C | $121,000 | None Available | |
| -- | $95,000 | -- | |
| -- | $89,500 | -- |
Source: Public Records
Mortgage History
| Date | Status | Borrower | Loan Amount |
|---|---|---|---|
| Open | Dmb Acquisitions Llc | $119,160 | |
| Previous Owner | Marshland Investments Llc | $500,000 | |
| Previous Owner | Hays James C | $121,000 |
Source: Public Records
Tax History Compared to Growth
Tax History
| Year | Tax Paid | Tax Assessment Tax Assessment Total Assessment is a certain percentage of the fair market value that is determined by local assessors to be the total taxable value of land and additions on the property. | Land | Improvement |
|---|---|---|---|---|
| 2025 | $1,153 | $46,938 | $12,180 | $34,758 |
| 2024 | $1,192 | $46,938 | $12,180 | $34,758 |
| 2023 | $1,048 | $41,274 | $12,180 | $29,094 |
| 2022 | $1,415 | $40,861 | $10,688 | $30,173 |
| 2021 | $1,553 | $40,861 | $10,688 | $30,173 |
| 2020 | $1,271 | $32,741 | $6,947 | $25,794 |
| 2019 | $1,282 | $32,741 | $6,947 | $25,794 |
| 2018 | $2,143 | $32,741 | $6,947 | $25,794 |
| 2017 | $1,227 | $32,741 | $6,947 | $25,794 |
| 2016 | $1,170 | $33,810 | $8,016 | $25,794 |
| 2015 | $1,813 | $37,016 | $11,222 | $25,794 |
| 2014 | $2,085 | $37,016 | $11,222 | $25,794 |
Source: Public Records
Map
Nearby Homes
- 3848 Berkley Dr
- 3698 Berkley Dr
- 4090 Napier Ave
- 227 Forest Hill Rd
- 3940 Grand Ave
- 3831 Fairmont Ave
- 3881 Grand Ave
- 3687 Overlook Ave
- 3687 Overlook Dr
- 3855 Mercer St
- 4403 Azalea Dr
- 4433 Azalea Dr
- 3821 Melrose St
- 4057 Brookdale Ave
- 4373 Barrington Place
- 3817 Lake St
- 4571 Shadow Lawn Dr
- 1402 Barrington Place
- 1406 Barrington Place
- 3341 Ridge Ave
- 182 Rest Haven Ave
- 3792 Avon Rd
- 3764 Avon Rd
- 3791 Berkley Dr
- 3781 Berkley Dr
- 3750 Avon Rd
- 3761 Berkley Dr
- 185 Rest Haven Ave
- 3736 Avon Rd
- 169 Rest Haven Ave
- 177 Rest Haven Ave
- 161 Rest Haven Ave
- 3747 Berkley Dr
- 3793 Avon Rd
- 3831 Berkley Dr
- 153 Rest Haven Ave
- 3722 Avon Rd
- 3722 Avon Rd Unit 14
- 3773 Avon Rd
- 3739 Berkley Dr