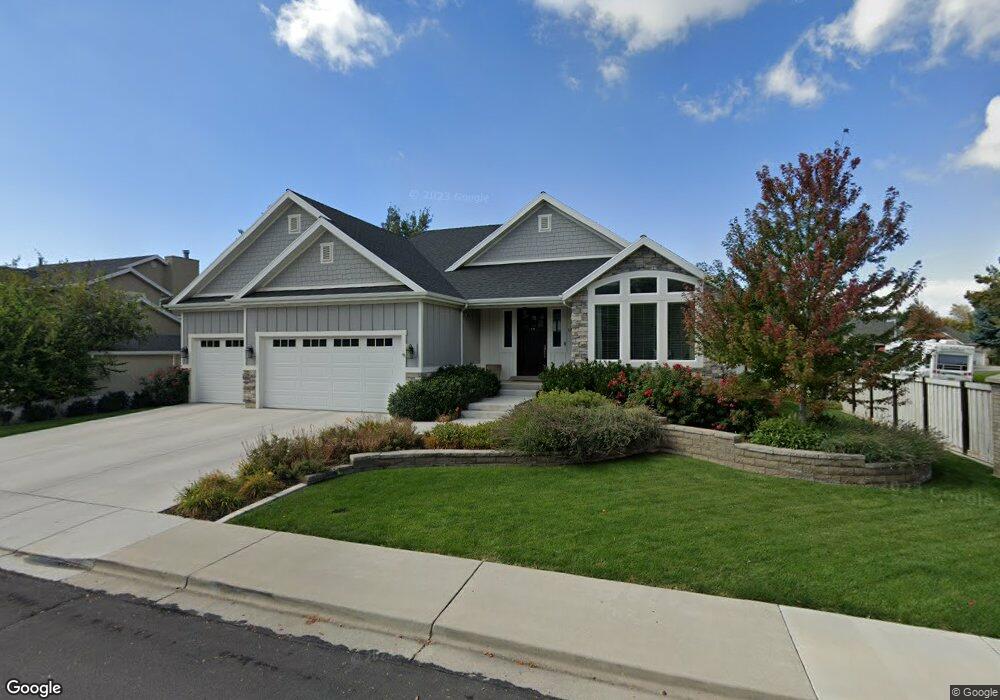
174 S 180 W Orem, UT 84058
Orem Park NeighborhoodEstimated Value: $732,000 - $790,000
3
Beds
4
Baths
1,833
Sq Ft
$418/Sq Ft
Est. Value
About This Home
This home is located at 174 S 180 W, Orem, UT 84058 and is currently estimated at $766,599, approximately $418 per square foot. 174 S 180 W is a home located in Utah County with nearby schools including Orem Elementary School, Orem Junior High School, and Mountain View High School.
Ownership History
Date
Name
Owned For
Owner Type
Purchase Details
Closed on
Feb 28, 2022
Sold by
Cole Brook D
Bought by
Brook And Rosemary Cole Living Trust
Current Estimated Value
Purchase Details
Closed on
Dec 23, 2016
Sold by
Cole Brook and Cole Rosemary
Bought by
Cole Brook D and Cole Rosemary W
Home Financials for this Owner
Home Financials are based on the most recent Mortgage that was taken out on this home.
Original Mortgage
$359,355
Interest Rate
3.57%
Mortgage Type
New Conventional
Purchase Details
Closed on
Jun 22, 2016
Sold by
Washburn Paul V and Washburn Steffani Y
Bought by
Cole Brook and Cole Rosemary
Home Financials for this Owner
Home Financials are based on the most recent Mortgage that was taken out on this home.
Original Mortgage
$24,528
Interest Rate
3.57%
Mortgage Type
Purchase Money Mortgage
Purchase Details
Closed on
Sep 18, 2015
Sold by
Gunn Gregory F and Gunn Cindy L
Bought by
Washburn Paul V and Washburn Steffani Y
Create a Home Valuation Report for This Property
The Home Valuation Report is an in-depth analysis detailing your home's value as well as a comparison with similar homes in the area
Home Values in the Area
Average Home Value in this Area
Purchase History
| Date | Buyer | Sale Price | Title Company |
|---|---|---|---|
| Brook And Rosemary Cole Living Trust | -- | None Listed On Document | |
| Cole Brook D | -- | Highland Title | |
| Cole Brook | -- | Title West | |
| Washburn Paul V | -- | Bartlett Title Insurn Agency |
Source: Public Records
Mortgage History
| Date | Status | Borrower | Loan Amount |
|---|---|---|---|
| Previous Owner | Cole Brook D | $359,355 | |
| Previous Owner | Cole Brook | $24,528 |
Source: Public Records
Tax History
| Year | Tax Paid | Tax Assessment Tax Assessment Total Assessment is a certain percentage of the fair market value that is determined by local assessors to be the total taxable value of land and additions on the property. | Land | Improvement |
|---|---|---|---|---|
| 2025 | $3,036 | $425,810 | -- | -- |
| 2024 | $3,036 | $371,195 | $0 | $0 |
| 2023 | $2,783 | $365,805 | $0 | $0 |
| 2022 | $2,695 | $343,200 | $0 | $0 |
| 2021 | $2,586 | $498,800 | $193,700 | $305,100 |
| 2020 | $2,422 | $459,000 | $168,400 | $290,600 |
| 2019 | $2,309 | $455,100 | $168,400 | $286,700 |
| 2018 | $2,125 | $400,200 | $132,600 | $267,600 |
| 2017 | $1,985 | $200,200 | $0 | $0 |
| 2016 | $1,156 | $107,500 | $0 | $0 |
| 2015 | $790 | $69,500 | $0 | $0 |
| 2014 | $761 | $66,600 | $0 | $0 |
Source: Public Records
Map
Nearby Homes
Your Personal Tour Guide
Ask me questions while you tour the home.