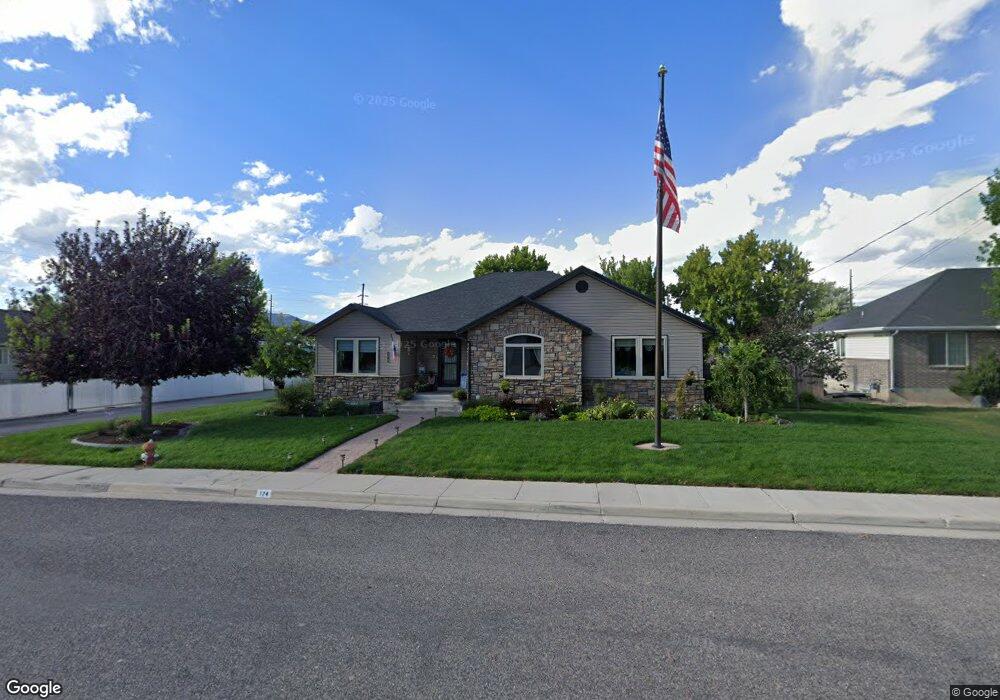
174 W 100 S Ephraim, UT 84627
Estimated Value: $468,000 - $551,000
4
Beds
2
Baths
3,750
Sq Ft
$136/Sq Ft
Est. Value
About This Home
This home is located at 174 W 100 S, Ephraim, UT 84627 and is currently estimated at $511,419, approximately $136 per square foot. 174 W 100 S is a home located in Sanpete County.
Ownership History
Date
Name
Owned For
Owner Type
Purchase Details
Closed on
Aug 26, 2020
Sold by
Pierson Gared F and Pierson Tina M
Bought by
Allen Terri Foote J
Current Estimated Value
Home Financials for this Owner
Home Financials are based on the most recent Mortgage that was taken out on this home.
Original Mortgage
$185,000
Outstanding Balance
$162,677
Interest Rate
2.9%
Mortgage Type
Construction
Estimated Equity
$348,742
Purchase Details
Closed on
Oct 10, 2012
Sold by
Parry Kayce and Parry Staci
Bought by
Pierson Gared F and Pierson Tina M
Create a Home Valuation Report for This Property
The Home Valuation Report is an in-depth analysis detailing your home's value as well as a comparison with similar homes in the area
Home Values in the Area
Average Home Value in this Area
Purchase History
| Date | Buyer | Sale Price | Title Company |
|---|---|---|---|
| Allen Terri Foote J | $231,250 | Us Title Ins Agcy | |
| Pierson Gared F | -- | D Land Title |
Source: Public Records
Mortgage History
| Date | Status | Borrower | Loan Amount |
|---|---|---|---|
| Open | Allen Terri Foote J | $185,000 |
Source: Public Records
Tax History
| Year | Tax Paid | Tax Assessment Tax Assessment Total Assessment is a certain percentage of the fair market value that is determined by local assessors to be the total taxable value of land and additions on the property. | Land | Improvement |
|---|---|---|---|---|
| 2025 | $1,145 | $319,611 | $0 | $0 |
| 2024 | $1,137 | $306,924 | $0 | $0 |
| 2023 | $3,289 | $288,191 | $0 | $0 |
| 2022 | $3,357 | $268,042 | $0 | $0 |
| 2021 | $3,241 | $223,692 | $0 | $0 |
| 2020 | $3,008 | $195,430 | $0 | $0 |
| 2019 | $2,836 | $181,286 | $0 | $0 |
| 2018 | $2,559 | $286,618 | $31,680 | $254,938 |
| 2017 | $2,262 | $145,833 | $0 | $0 |
| 2016 | $2,142 | $138,134 | $0 | $0 |
| 2015 | $2,152 | $138,134 | $0 | $0 |
| 2014 | $1,883 | $122,866 | $0 | $0 |
| 2013 | $1,875 | $122,866 | $0 | $0 |
Source: Public Records
Map
Nearby Homes
Your Personal Tour Guide
Ask me questions while you tour the home.