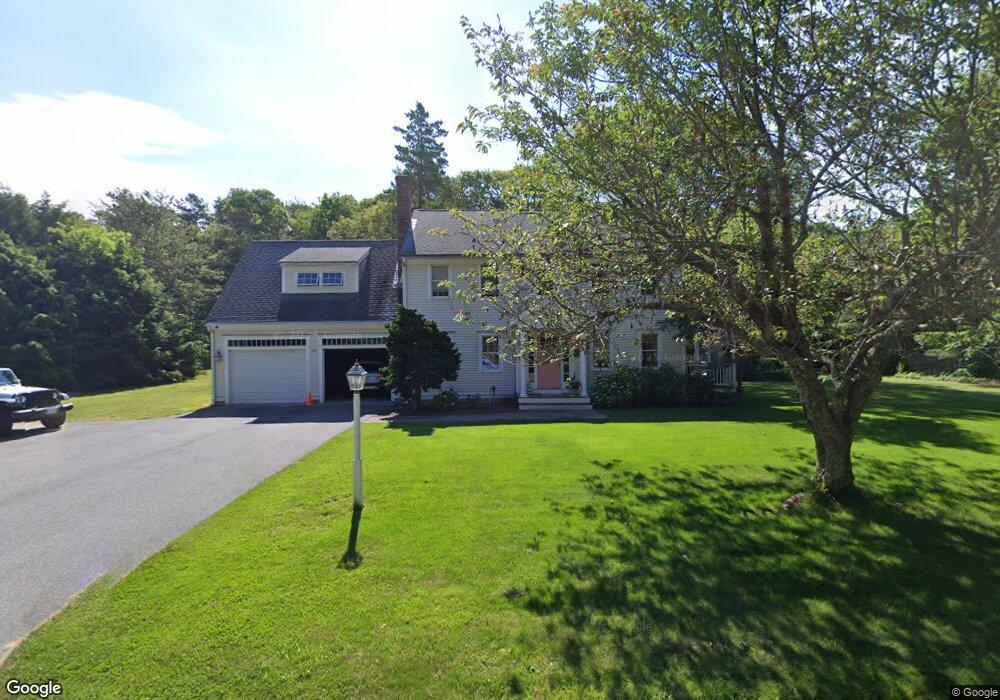
174 Walnut St Marstons Mills, MA 02648
Marstons Mills NeighborhoodEstimated Value: $731,000 - $826,000
3
Beds
3
Baths
2,305
Sq Ft
$342/Sq Ft
Est. Value
About This Home
This home is located at 174 Walnut St, Marstons Mills, MA 02648 and is currently estimated at $787,984, approximately $341 per square foot. 174 Walnut St is a home with nearby schools including West Villages Elementary School, Barnstable United Elementary School, and Barnstable Intermediate School.
Ownership History
Date
Name
Owned For
Owner Type
Purchase Details
Closed on
Nov 8, 2018
Sold by
Childs Shauna H and Childs Peter M
Bought by
Childs T
Current Estimated Value
Purchase Details
Closed on
Jan 23, 2012
Sold by
Childs Ft
Bought by
Childs Shauna H and Childs Peter M
Purchase Details
Closed on
Apr 15, 2008
Sold by
Childs Peter M and Childs Peter
Bought by
Childs Ft
Purchase Details
Closed on
Apr 20, 2005
Sold by
J & J Rt
Bought by
Childs Peter M and Childs Shauna H
Create a Home Valuation Report for This Property
The Home Valuation Report is an in-depth analysis detailing your home's value as well as a comparison with similar homes in the area
Home Values in the Area
Average Home Value in this Area
Purchase History
| Date | Buyer | Sale Price | Title Company |
|---|---|---|---|
| Childs T | -- | -- | |
| Childs Shauna H | -- | -- | |
| Childs Ft | -- | -- | |
| Childs Peter M | $250,000 | -- |
Source: Public Records
Tax History
| Year | Tax Paid | Tax Assessment Tax Assessment Total Assessment is a certain percentage of the fair market value that is determined by local assessors to be the total taxable value of land and additions on the property. | Land | Improvement |
|---|---|---|---|---|
| 2025 | $6,254 | $773,000 | $176,300 | $596,700 |
| 2024 | $5,728 | $733,400 | $176,300 | $557,100 |
| 2023 | $5,364 | $643,200 | $160,300 | $482,900 |
| 2022 | $4,981 | $516,700 | $118,800 | $397,900 |
| 2021 | $5,089 | $485,100 | $118,800 | $366,300 |
| 2020 | $4,929 | $449,700 | $118,800 | $330,900 |
| 2019 | $5,069 | $449,400 | $118,800 | $330,600 |
| 2018 | $4,602 | $410,200 | $125,000 | $285,200 |
| 2017 | $4,321 | $401,600 | $125,000 | $276,600 |
| 2016 | $4,377 | $401,600 | $125,000 | $276,600 |
| 2015 | $4,194 | $386,500 | $124,000 | $262,500 |
Source: Public Records
Map
Nearby Homes
- 1028 Old Falmouth Rd
- 1044 Old Falmouth Rd
- 87 Foxglove Rd
- 80 Branch Terrace
- 74 Saddler Ln
- 315 Prince Hinckley Rd
- 62 Three Ponds Dr
- 900 Old Stage Rd
- 324 Patriot Way
- 32 Willington Ave
- 7 Ebenezer
- 84 White Birch Way
- 296 Buckskin Path
- 192 Sandy Valley Rd
- 66 Tern Ln
- 282 Parker Rd
- 51 Larch Ln
- 200 Lumbert Mill Rd
- 82 Yacht Club Rd
- 19 Marrick Ct
Your Personal Tour Guide
Ask me questions while you tour the home.