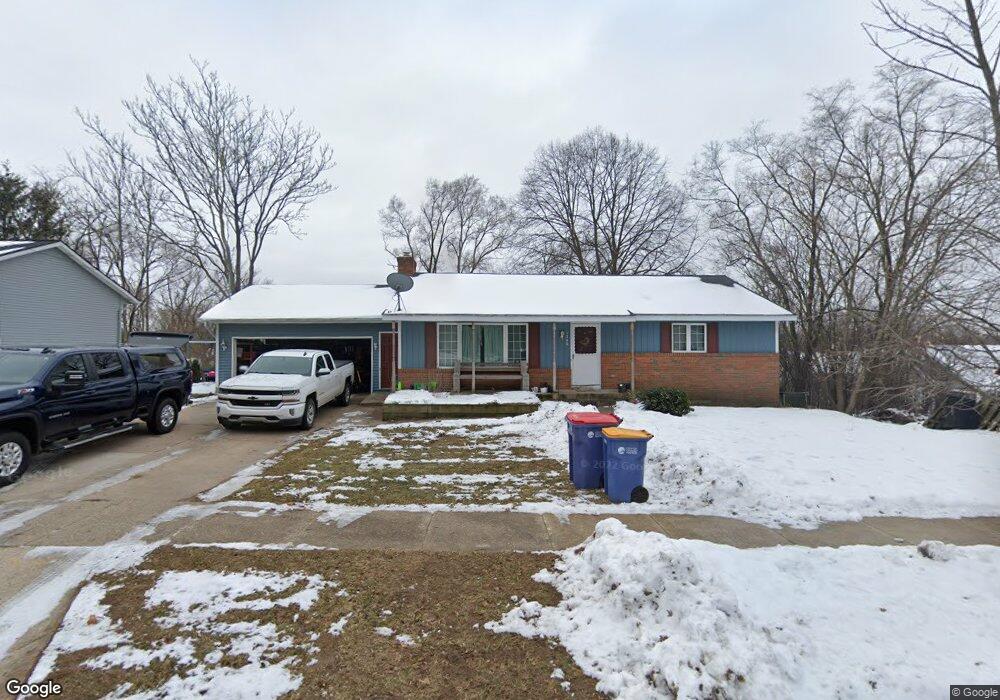
1740 Briarcliff Dr NE Grand Rapids, MI 49505
Creston NeighborhoodEstimated Value: $315,000 - $361,000
4
Beds
2
Baths
1,176
Sq Ft
$291/Sq Ft
Est. Value
About This Home
This home is located at 1740 Briarcliff Dr NE, Grand Rapids, MI 49505 and is currently estimated at $342,592, approximately $291 per square foot. 1740 Briarcliff Dr NE is a home located in Kent County with nearby schools including Riverside Middle School, Union High School, and Lighthouse Academy - Waalkes Campus.
Ownership History
Date
Name
Owned For
Owner Type
Purchase Details
Closed on
Feb 7, 2012
Sold by
Kobel Robert D
Bought by
Kobel Robert D and Kobel Erin A
Current Estimated Value
Home Financials for this Owner
Home Financials are based on the most recent Mortgage that was taken out on this home.
Original Mortgage
$128,500
Outstanding Balance
$88,120
Interest Rate
3.91%
Mortgage Type
New Conventional
Estimated Equity
$254,472
Purchase Details
Closed on
Feb 4, 2012
Sold by
Kobel Heather
Bought by
Kobel Robert D
Home Financials for this Owner
Home Financials are based on the most recent Mortgage that was taken out on this home.
Original Mortgage
$128,500
Outstanding Balance
$88,120
Interest Rate
3.91%
Mortgage Type
New Conventional
Estimated Equity
$254,472
Purchase Details
Closed on
Jun 3, 1998
Sold by
Vndrb Ts and Vndrb J
Bought by
Kobel Robert D Erin A
Purchase Details
Closed on
Mar 21, 1994
Sold by
Vanderbe Vanderbe and Ts Vanderbe
Bought by
Kobel Robert D Erin A
Create a Home Valuation Report for This Property
The Home Valuation Report is an in-depth analysis detailing your home's value as well as a comparison with similar homes in the area
Home Values in the Area
Average Home Value in this Area
Purchase History
| Date | Buyer | Sale Price | Title Company |
|---|---|---|---|
| Kobel Robert D | -- | None Available | |
| Kobel Robert D | -- | None Available | |
| Kobel Robert D Erin A | -- | -- | |
| Kobel Robert D Erin A | -- | -- |
Source: Public Records
Mortgage History
| Date | Status | Borrower | Loan Amount |
|---|---|---|---|
| Open | Kobel Robert D | $128,500 |
Source: Public Records
Tax History Compared to Growth
Tax History
| Year | Tax Paid | Tax Assessment Tax Assessment Total Assessment is a certain percentage of the fair market value that is determined by local assessors to be the total taxable value of land and additions on the property. | Land | Improvement |
|---|---|---|---|---|
| 2025 | $2,570 | $159,300 | $0 | $0 |
| 2024 | $2,570 | $140,000 | $0 | $0 |
| 2023 | $2,608 | $117,600 | $0 | $0 |
| 2022 | $2,476 | $112,700 | $0 | $0 |
| 2021 | $2,421 | $102,800 | $0 | $0 |
| 2020 | $2,314 | $97,800 | $0 | $0 |
| 2019 | $2,341 | $91,600 | $0 | $0 |
| 2018 | $2,341 | $91,000 | $0 | $0 |
| 2017 | $2,279 | $81,000 | $0 | $0 |
| 2016 | $2,306 | $75,300 | $0 | $0 |
| 2015 | $2,145 | $75,300 | $0 | $0 |
| 2013 | -- | $63,500 | $0 | $0 |
Source: Public Records
Map
Nearby Homes
- 1759 Briarcliff Dr NE
- 2268 Thistledowne Dr NE
- 2037 Tall Meadow St NE Unit 13
- 2016 Tall Meadow St NE
- 2058 Ken Ade St NE Unit 147
- 2041 Krislin St
- 2112 Jo Dean Ct NE
- 2027 Joan Ave NE
- 1335 Knapp St NE
- 2100 Dawson Ave NE
- 2753 Dean Lake Ave NE
- 1739 Waldorn Ave NE
- 1335 Northlawn St NE
- 1666 Carlton Ave NE
- 1524 Sweet St NE
- 1444 Sweet St NE
- 2833 Aldale Dr NE
- 2324 Whimbrel Ct NE
- 2420 Hylane Ct NE
- 1600 Cherry Hill Dr NE
- 1746 Briarcliff Dr NE
- 1752 Briarcliff Dr NE
- 1741 Briarcliff Dr NE
- 1760 Briarcliff Dr NE
- 2216 Devonshire Dr NE
- 2229 Devonshire Dr NE
- 2224 Devonshire Dr NE
- 2237 Devonshire Dr NE
- 2232 Devonshire Dr NE
- 2243 Devonshire Dr NE
- 2238 Devonshire Dr NE
- 1820 Cross Bend St NE
- 1822 Cross Bend St NE Unit 74
- 2244 Devonshire Dr NE
- 2251 Devonshire Dr NE
- 1824 Cross Bend St NE
- 1824 Cross Bend St NE Unit 75
- 1826 Cross Bend St NE Unit 76
- 2257 Devonshire Dr NE
- 2252 Devonshire Dr NE