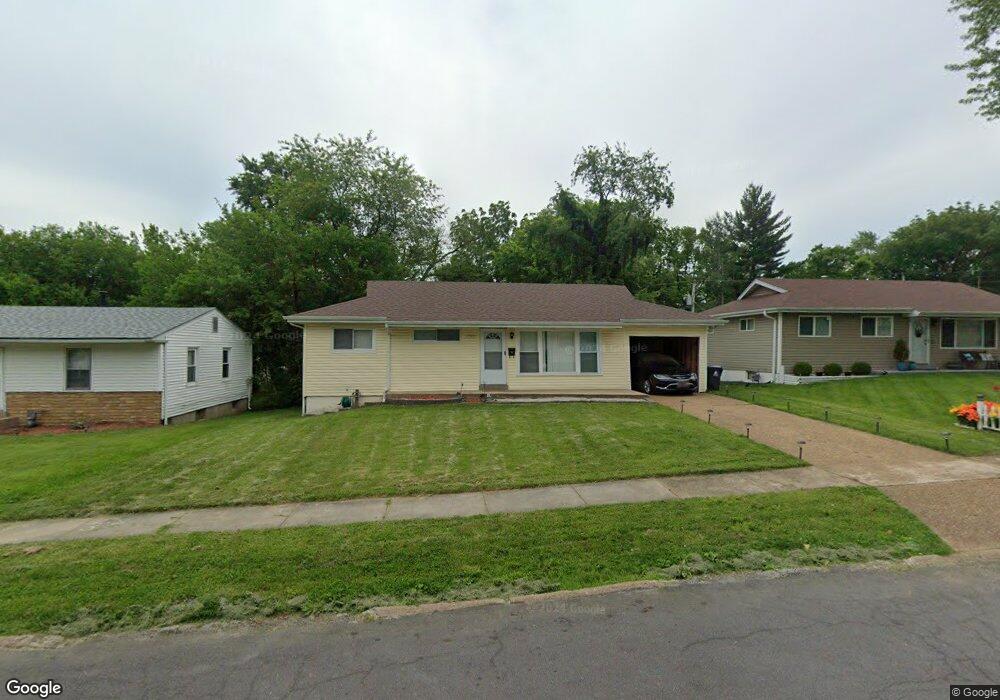
1740 Clover Ln Florissant, MO 63031
Estimated Value: $106,000 - $143,000
3
Beds
2
Baths
988
Sq Ft
$131/Sq Ft
Est. Value
About This Home
This home is located at 1740 Clover Ln, Florissant, MO 63031 and is currently estimated at $129,436, approximately $131 per square foot. 1740 Clover Ln is a home located in St. Louis County with nearby schools including Armstrong Elementary School, West Middle School, and Hazelwood West High School.
Ownership History
Date
Name
Owned For
Owner Type
Purchase Details
Closed on
Jul 22, 2019
Sold by
Nguyen Tri and Nguyen Yen T
Bought by
Clover Llc Series
Current Estimated Value
Purchase Details
Closed on
Aug 25, 2014
Sold by
Nguyen Tri and Thorson Lacey
Bought by
Nguyen Tri
Purchase Details
Closed on
Feb 13, 2012
Sold by
Nguyen Ngan T
Bought by
Nguyen Tri and Thorson Lacey
Purchase Details
Closed on
Sep 23, 2011
Sold by
Secretary Of Housing & Urban Development
Bought by
Nguyen Ngan T
Purchase Details
Closed on
Feb 17, 2011
Sold by
U S Bank N A
Bought by
Secretary Of Housing & Urban Development
Purchase Details
Closed on
Jan 25, 2011
Sold by
Haney Tonya
Bought by
U S Bank N A
Purchase Details
Closed on
Oct 9, 2007
Sold by
Andreski Kenneth E and Andreski Terry L
Bought by
Haney Tonya
Home Financials for this Owner
Home Financials are based on the most recent Mortgage that was taken out on this home.
Original Mortgage
$109,038
Interest Rate
6.48%
Mortgage Type
FHA
Create a Home Valuation Report for This Property
The Home Valuation Report is an in-depth analysis detailing your home's value as well as a comparison with similar homes in the area
Home Values in the Area
Average Home Value in this Area
Purchase History
| Date | Buyer | Sale Price | Title Company |
|---|---|---|---|
| Clover Llc Series | -- | None Available | |
| Nguyen Tri | -- | None Available | |
| Nguyen Tri | -- | None Available | |
| Nguyen Ngan T | -- | None Available | |
| Secretary Of Housing & Urban Development | $116,535 | None Available | |
| U S Bank N A | $139,018 | None Available | |
| Haney Tonya | $109,900 | Ort |
Source: Public Records
Mortgage History
| Date | Status | Borrower | Loan Amount |
|---|---|---|---|
| Previous Owner | Haney Tonya | $109,038 |
Source: Public Records
Tax History Compared to Growth
Tax History
| Year | Tax Paid | Tax Assessment Tax Assessment Total Assessment is a certain percentage of the fair market value that is determined by local assessors to be the total taxable value of land and additions on the property. | Land | Improvement |
|---|---|---|---|---|
| 2025 | $1,939 | $24,340 | $3,670 | $20,670 |
| 2024 | $1,939 | $21,550 | $2,850 | $18,700 |
| 2023 | $1,937 | $21,550 | $2,850 | $18,700 |
| 2022 | $1,429 | $14,060 | $3,250 | $10,810 |
| 2021 | $1,392 | $14,060 | $3,250 | $10,810 |
| 2020 | $1,325 | $12,650 | $2,050 | $10,600 |
| 2019 | $1,305 | $12,650 | $2,050 | $10,600 |
| 2018 | $1,284 | $11,440 | $1,350 | $10,090 |
| 2017 | $1,282 | $11,440 | $1,350 | $10,090 |
| 2016 | $1,327 | $11,690 | $1,730 | $9,960 |
| 2015 | $1,299 | $11,690 | $1,730 | $9,960 |
| 2014 | $1,462 | $13,590 | $2,130 | $11,460 |
Source: Public Records
Map
Nearby Homes
- 515 Marechal Ln
- 8405 Rena Ct
- 840 Pershall Rd
- 45 Chateau Dr
- 8435 Bridle Spur Dr
- 7040 Clover Ln
- 7350 N Hanley Rd
- 144 Flora Dr
- 24 Valley Dr
- 7299 N Hanley Rd Unit B
- 1375 S New Florissant Rd
- 40 Connolly Dr
- 8713 Nyflot Ave
- 135 Anistasia Dr
- 8401 Saint Olaf Dr
- 230 Anistasia Dr
- 8740 Santa Bella Dr Unit C
- 1815 S New Florissant Rd
- 38 Spring Dr
- 250 Maple Dr