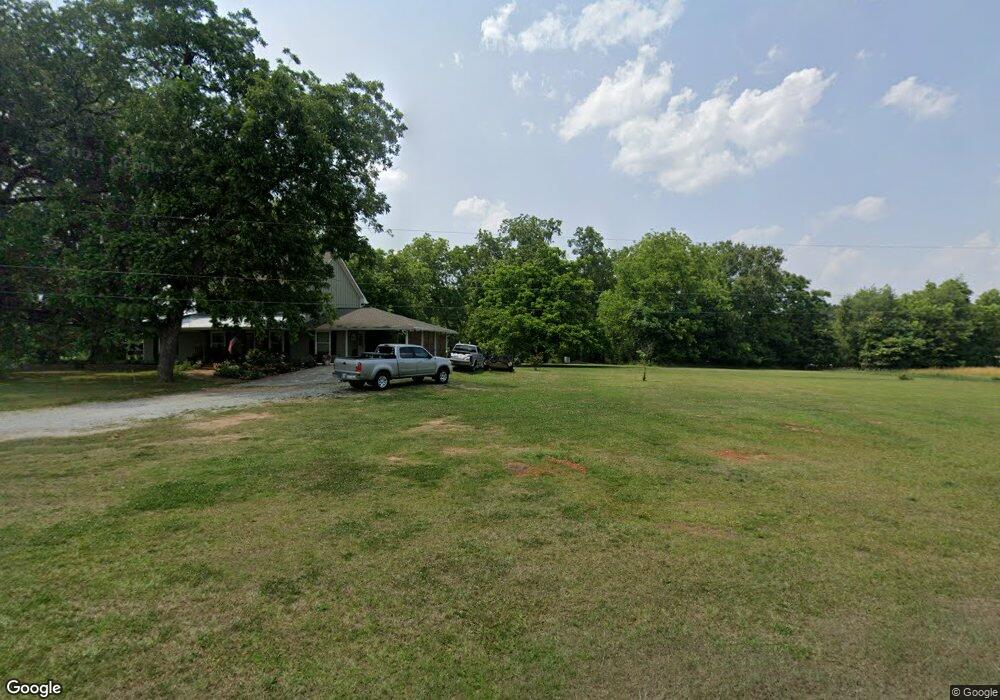
1740 Lower Apalachee Rd Madison, GA 30650
Estimated Value: $328,190 - $530,000
2
Beds
2
Baths
1,584
Sq Ft
$260/Sq Ft
Est. Value
About This Home
This home is located at 1740 Lower Apalachee Rd, Madison, GA 30650 and is currently estimated at $411,798, approximately $259 per square foot. 1740 Lower Apalachee Rd is a home located in Morgan County with nearby schools including Morgan County Primary School, Morgan County Elementary School, and Morgan County Middle School.
Ownership History
Date
Name
Owned For
Owner Type
Purchase Details
Closed on
Apr 19, 2023
Sold by
Shelby Sydnie
Bought by
Knobloch Christian Mallory and Knobloch Caleb Montgomery
Current Estimated Value
Purchase Details
Closed on
Apr 14, 2023
Sold by
Erwin Ronald M
Bought by
Shelby Sydnie
Purchase Details
Closed on
Oct 31, 2013
Sold by
Sec Of Housing & U
Bought by
Bank Of America
Purchase Details
Closed on
Mar 10, 2011
Sold by
Stephens David Wayne
Bought by
Stephens Nikki
Purchase Details
Closed on
Sep 29, 2010
Sold by
Stephens David W
Bought by
Stephens David Wayne
Purchase Details
Closed on
Dec 29, 2000
Sold by
Stephens Frances
Bought by
Stephens David Wayne
Purchase Details
Closed on
Dec 28, 2000
Sold by
Jansen Elizabeth S
Bought by
Stephens Frances
Purchase Details
Closed on
Apr 12, 1990
Sold by
Stephens Jake B
Bought by
Jansen Elizabeth S
Create a Home Valuation Report for This Property
The Home Valuation Report is an in-depth analysis detailing your home's value as well as a comparison with similar homes in the area
Home Values in the Area
Average Home Value in this Area
Purchase History
| Date | Buyer | Sale Price | Title Company |
|---|---|---|---|
| Knobloch Christian Mallory | -- | -- | |
| Shelby Sydnie | -- | -- | |
| Bank Of America | -- | -- | |
| Stephens Nikki | -- | -- | |
| Stephens David Wayne | -- | -- | |
| Stephens David Wayne | -- | -- | |
| Stephens Frances | -- | -- | |
| Jansen Elizabeth S | -- | -- |
Source: Public Records
Tax History Compared to Growth
Tax History
| Year | Tax Paid | Tax Assessment Tax Assessment Total Assessment is a certain percentage of the fair market value that is determined by local assessors to be the total taxable value of land and additions on the property. | Land | Improvement |
|---|---|---|---|---|
| 2024 | $1,940 | $87,165 | $19,751 | $67,414 |
| 2023 | $1,766 | $75,130 | $14,890 | $60,240 |
| 2022 | $1,622 | $66,324 | $13,536 | $52,788 |
| 2021 | $1,925 | $78,375 | $28,602 | $49,773 |
| 2020 | $1,943 | $78,375 | $28,602 | $49,773 |
| 2019 | $1,777 | $70,542 | $20,729 | $49,813 |
| 2018 | $1,756 | $68,658 | $18,845 | $49,813 |
| 2017 | $3,205 | $123,720 | $31,186 | $92,534 |
| 2016 | $2,890 | $109,234 | $30,878 | $78,357 |
| 2015 | $2,358 | $93,640 | $31,520 | $62,120 |
| 2014 | $1,606 | $61,613 | $32,240 | $29,373 |
| 2013 | -- | $58,624 | $32,320 | $26,304 |
Source: Public Records
Map
Nearby Homes
- 1021 Boones Bridge Rd
- 1040 Greenwood Cir
- 1010 Greenwood Cir
- 0 Turner Rd Unit 10469447
- 0 Turner Rd Unit 7532891
- 1031 Gage Ln
- Everett with Basement Plan at Wellington Estates
- 1021 Gage Ln
- Sinclair Plan at Wellington Estates
- Fairmont with Basement Plan at Wellington Estates
- Fairmont Plan at Wellington Estates
- Sullivan Plan at Wellington Estates
- Bristol Plan at Wellington Estates
- Everett Plan at Wellington Estates
- 0 Gage Ln Unit 10545635
- 0 Gage Ln Unit 68832
- 0 Creekview Dr Unit 10545636
- 0 Creekview Dr Unit 10545628
- 0 Creekview Dr Unit 68833
- 0 Creekview Dr Unit 68831
- 1700 Lower Apalachee Rd
- 1748 Lower Apalachee Rd
- 1748 Lower Apalachee Rd
- 1830 Lower Apalachee Rd
- 1620 Lower Apalachee Rd
- 1851 Lower Apalachee Rd
- 1590 Lower Apalachee Rd
- 1861 Lower Apalachee Rd
- 1571 Lower Apalachee Rd
- 1571 Lower Apalachee Rd
- 1901 Lower Apalachee Rd
- 1681 Lower Apalachee Rd
- 1911 Lower Apalachee Rd
- 1575 Lower Apalachee Rd
- 1561A Morris Rd
- 1451 Boones Bridge Rd
- 1061 Boones Bridge Rd
- 1251 Boones Bridge Rd
- 1181 Boones Bridge Rd
- 1060 Boones Bridge Rd