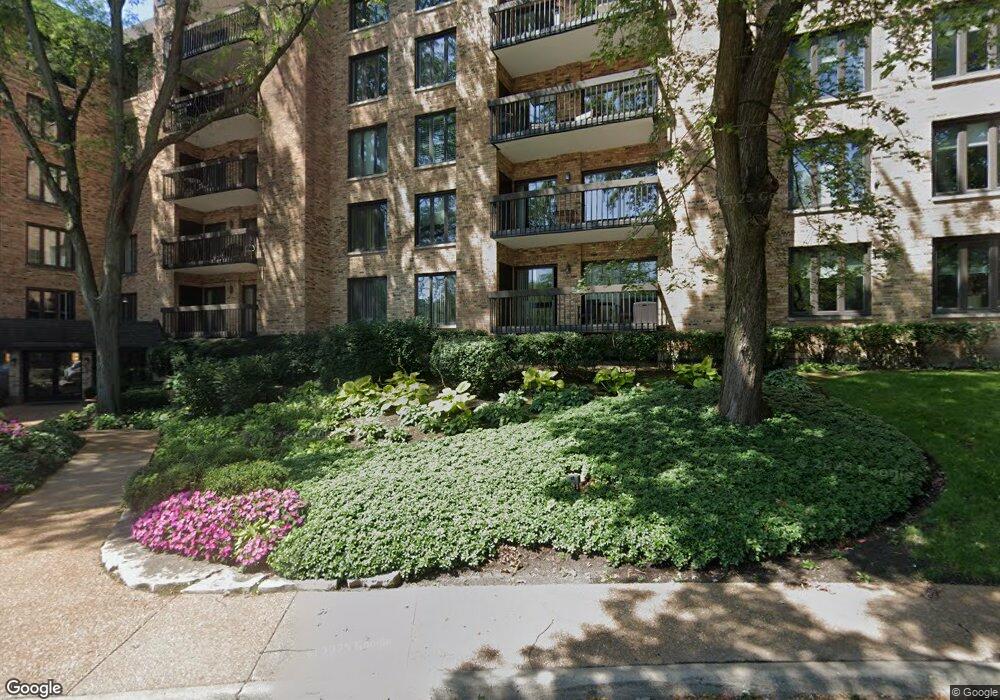
1740 Mission Hills Rd Unit 30 Northbrook, IL 60062
Estimated Value: $575,234 - $671,000
3
Beds
2
Baths
2,450
Sq Ft
$250/Sq Ft
Est. Value
About This Home
This home is located at 1740 Mission Hills Rd Unit 30, Northbrook, IL 60062 and is currently estimated at $612,309, approximately $249 per square foot. 1740 Mission Hills Rd Unit 30 is a home located in Cook County with nearby schools including Henry Winkelman Elementary School, Field Middle School, and Glenbrook North High School.
Ownership History
Date
Name
Owned For
Owner Type
Purchase Details
Closed on
Jun 10, 2019
Sold by
Gottstein Marley J
Bought by
Gottstein Marley J and Marley J Gottstein Trust
Current Estimated Value
Purchase Details
Closed on
Feb 12, 2018
Sold by
Marlow Investment Group Llc Series 34
Bought by
Gottstein Marley J
Purchase Details
Closed on
Dec 1, 2017
Sold by
Rumick Richard A and The Beverly Dubin Lauren Decla
Bought by
Marlow Investment Group Llc Series 34
Purchase Details
Closed on
Apr 27, 2005
Sold by
Lauren Beverly
Bought by
Lauren Beverly Dubin and Beverly Dubin Declaration Of T
Purchase Details
Closed on
Oct 5, 1998
Sold by
Somerman Shirley
Bought by
Beverly Lauren Bernard and Beverly Lauren
Purchase Details
Closed on
May 9, 1994
Sold by
The Mid City National Bank Of Chicago
Bought by
Somerman Shirley
Create a Home Valuation Report for This Property
The Home Valuation Report is an in-depth analysis detailing your home's value as well as a comparison with similar homes in the area
Home Values in the Area
Average Home Value in this Area
Purchase History
| Date | Buyer | Sale Price | Title Company |
|---|---|---|---|
| Gottstein Marley J | -- | Attorney | |
| Gottstein Marley J | $410,000 | Chicago Title | |
| Marlow Investment Group Llc Series 34 | $340,000 | Attorney | |
| Lauren Beverly Dubin | -- | -- | |
| Beverly Lauren Bernard | $276,000 | Chicago Title Insurance Co | |
| Somerman Shirley | -- | -- |
Source: Public Records
Tax History Compared to Growth
Tax History
| Year | Tax Paid | Tax Assessment Tax Assessment Total Assessment is a certain percentage of the fair market value that is determined by local assessors to be the total taxable value of land and additions on the property. | Land | Improvement |
|---|---|---|---|---|
| 2024 | $7,419 | $42,780 | $497 | $42,283 |
| 2023 | $7,323 | $42,780 | $497 | $42,283 |
| 2022 | $7,323 | $42,780 | $497 | $42,283 |
| 2021 | $6,886 | $35,880 | $438 | $35,442 |
| 2020 | $6,642 | $35,880 | $438 | $35,442 |
| 2019 | $6,417 | $39,374 | $438 | $38,936 |
| 2018 | $6,374 | $30,143 | $380 | $29,763 |
| 2017 | $6,253 | $30,143 | $380 | $29,763 |
| 2016 | $5,075 | $30,143 | $380 | $29,763 |
| 2015 | $4,228 | $22,220 | $307 | $21,913 |
| 2014 | $4,141 | $22,220 | $307 | $21,913 |
| 2013 | $4,042 | $22,220 | $307 | $21,913 |
Source: Public Records
Map
Nearby Homes
- 3810 Mission Hills Rd Unit 502
- 1671 Mission Hills Rd Unit 302
- 1671 Mission Hills Rd Unit S
- 1671 Mission Hills Rd Unit 501
- 3801 Mission Hills Rd Unit 204
- 3801 Mission Hills Rd Unit 304
- 3851 Mission Hills Rd Unit 409
- 3801 Mission Hills Rd Unit 510
- 3741 Mission Hills Rd Unit 110
- 3741 Mission Hills Rd Unit 209
- 1621 Mission Hills Rd Unit 104
- 3900 Mission Hills Rd Unit 407
- 3899 Mission Hills Rd Unit 4
- 3955 Mission Hills Rd Unit D
- 1891 Mission Hills Ln Unit 4
- 1935 Mission Hills Ln Unit 6C
- 1696 Highland Ave
- 3969 Maple Ave
- 3829 Eastwind Ct
- 4001 Walters Ave
- 1740 Mission Hills Rd Unit 410
- 1740 Mission Hills Rd Unit 107
- 1740 Mission Hills Rd Unit 212
- 1740 Mission Hills Rd Unit 103
- 1740 Mission Hills Rd Unit 104
- 1740 Mission Hills Rd Unit 20
- 1740 Mission Hills Rd Unit 20
- 1740 Mission Hills Rd Unit 40
- 1740 Mission Hills Rd Unit 20
- 1740 Mission Hills Rd Unit 40
- 1740 Mission Hills Rd Unit 10
- 1740 Mission Hills Rd Unit 51
- 1740 Mission Hills Rd Unit 41
- 1740 Mission Hills Rd Unit 21
- 1740 Mission Hills Rd Unit 50
- 1740 Mission Hills Rd Unit 20
- 1740 Mission Hills Rd Unit 40
- 1740 Mission Hills Rd Unit 11
- 1740 Mission Hills Rd Unit 20
- 1740 Mission Hills Rd Unit 40