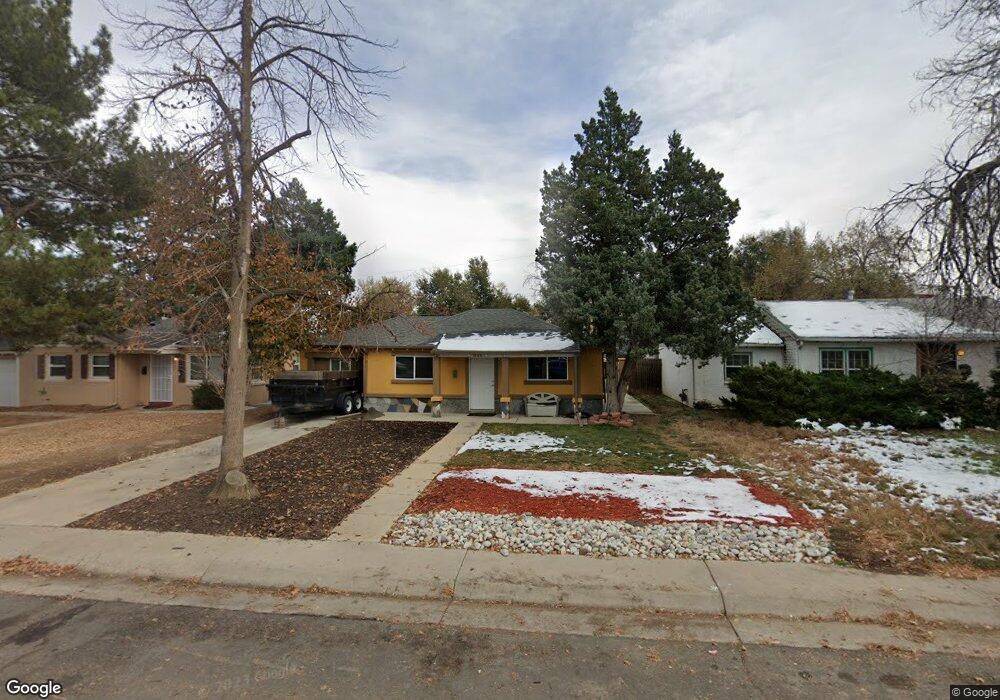
1740 Oswego St Aurora, CO 80010
North Aurora NeighborhoodEstimated Value: $322,000 - $353,000
3
Beds
1
Bath
906
Sq Ft
$367/Sq Ft
Est. Value
About This Home
This home is located at 1740 Oswego St, Aurora, CO 80010 and is currently estimated at $332,539, approximately $367 per square foot. 1740 Oswego St is a home located in Adams County with nearby schools including Montview Elementary School, North Middle School Health Sciences & Technology, and Aurora Central High School.
Ownership History
Date
Name
Owned For
Owner Type
Purchase Details
Closed on
Jun 20, 2011
Sold by
Salazar Beverly A
Bought by
Ortiz Mariano
Current Estimated Value
Purchase Details
Closed on
Dec 29, 1995
Sold by
Frazier Norman C and Frazier Kathleen A
Bought by
Salazar Beverly A
Purchase Details
Closed on
Jul 13, 1994
Sold by
Frazier Norman C
Bought by
Frazier Norman C and Frazier Kathleen A
Purchase Details
Closed on
Aug 21, 1992
Purchase Details
Closed on
Oct 4, 1991
Purchase Details
Closed on
Oct 2, 1991
Create a Home Valuation Report for This Property
The Home Valuation Report is an in-depth analysis detailing your home's value as well as a comparison with similar homes in the area
Home Values in the Area
Average Home Value in this Area
Purchase History
| Date | Buyer | Sale Price | Title Company |
|---|---|---|---|
| Ortiz Mariano | $50,000 | Axis Title & Escrow | |
| Salazar Beverly A | $54,500 | Empire Title & Escrow | |
| Frazier Norman C | -- | -- | |
| -- | $36,300 | -- | |
| -- | -- | -- | |
| -- | -- | -- |
Source: Public Records
Tax History
| Year | Tax Paid | Tax Assessment Tax Assessment Total Assessment is a certain percentage of the fair market value that is determined by local assessors to be the total taxable value of land and additions on the property. | Land | Improvement |
|---|---|---|---|---|
| 2025 | $2,043 | $21,620 | $5,440 | $16,180 |
| 2024 | $2,043 | $19,880 | $5,000 | $14,880 |
| 2023 | $2,075 | $23,200 | $5,210 | $17,990 |
| 2022 | $2,060 | $18,130 | $5,350 | $12,780 |
| 2021 | $2,146 | $18,130 | $5,350 | $12,780 |
| 2020 | $2,324 | $19,690 | $5,510 | $14,180 |
| 2019 | $2,319 | $19,690 | $5,510 | $14,180 |
| 2018 | $1,565 | $13,230 | $4,320 | $8,910 |
| 2017 | $1,390 | $13,230 | $4,320 | $8,910 |
| 2016 | $762 | $7,190 | $2,390 | $4,800 |
| 2015 | $738 | $7,190 | $2,390 | $4,800 |
| 2014 | -- | $5,900 | $1,350 | $4,550 |
Source: Public Records
Map
Nearby Homes
- 1764 Oswego St
- 1671 Oswego St
- 1781 N Oakland St
- 1764 Newark St
- 1945 Nome St
- 1605 Oakland St
- 1680 Newark St
- 11916 E 14th Ave
- 1732 Lansing St
- 2045 Lima St
- 2209 Macon St
- 12056 E 25th Ave
- 2341 Oakland St
- 1902 Kenton St
- 1400 Lima St
- 2381 Oswego St
- 11087 Montview Blvd
- 2381 Nome St
- 1273 Newark St
- 1350 Scranton St
Your Personal Tour Guide
Ask me questions while you tour the home.