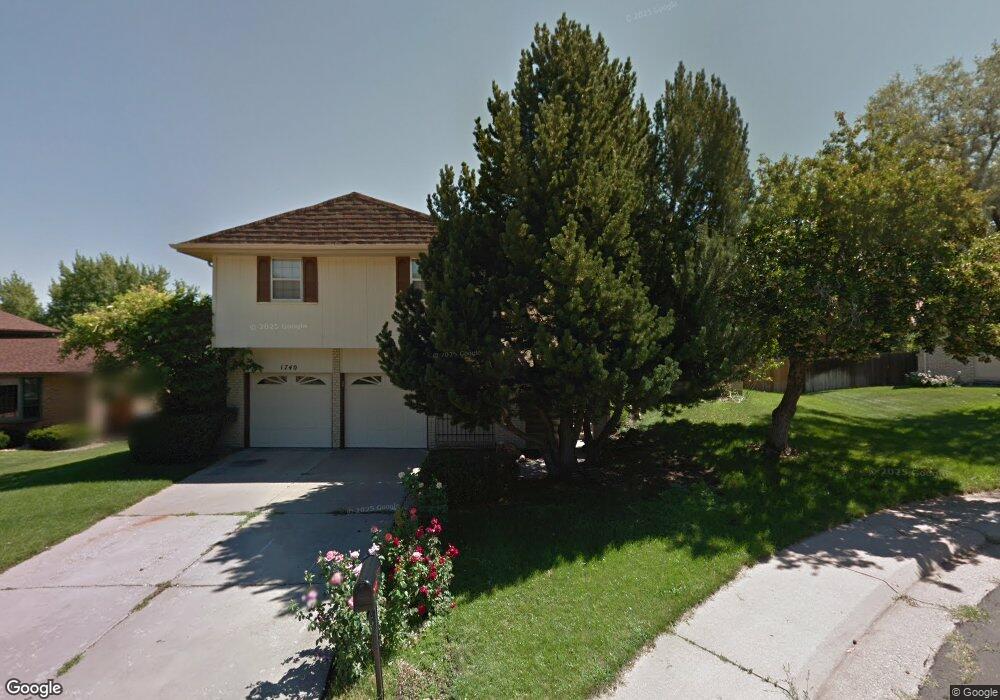
1740 S Parfet Ct Denver, CO 80232
Green Mountain NeighborhoodEstimated Value: $683,000 - $749,000
4
Beds
3
Baths
2,413
Sq Ft
$295/Sq Ft
Est. Value
About This Home
This home is located at 1740 S Parfet Ct, Denver, CO 80232 and is currently estimated at $712,016, approximately $295 per square foot. 1740 S Parfet Ct is a home located in Jefferson County with nearby schools including Kendrick Lakes Elementary School, Carmody Middle School, and Bear Creek High School.
Ownership History
Date
Name
Owned For
Owner Type
Purchase Details
Closed on
Oct 21, 2011
Sold by
Prudential Relocation Inc
Bought by
Street Martin P and Street Alyssa L
Current Estimated Value
Home Financials for this Owner
Home Financials are based on the most recent Mortgage that was taken out on this home.
Original Mortgage
$235,125
Outstanding Balance
$160,596
Interest Rate
4.13%
Mortgage Type
New Conventional
Estimated Equity
$551,420
Purchase Details
Closed on
Jul 24, 2002
Sold by
Caulk Stephen F and Caulk Suzanne
Bought by
Koel Kenneth G and Koel Karen K
Home Financials for this Owner
Home Financials are based on the most recent Mortgage that was taken out on this home.
Original Mortgage
$130,000
Interest Rate
6.69%
Purchase Details
Closed on
Aug 30, 1999
Sold by
Wade Daylon A and Wade Claris J
Bought by
Caulk Stephen F and Caulk Suzanne
Home Financials for this Owner
Home Financials are based on the most recent Mortgage that was taken out on this home.
Original Mortgage
$178,400
Interest Rate
7.58%
Create a Home Valuation Report for This Property
The Home Valuation Report is an in-depth analysis detailing your home's value as well as a comparison with similar homes in the area
Home Values in the Area
Average Home Value in this Area
Purchase History
| Date | Buyer | Sale Price | Title Company |
|---|---|---|---|
| Street Martin P | $247,500 | Stewart Title | |
| Prudential Relocation Inc | $247,500 | Stewart Title | |
| Koel Kenneth G | $280,000 | Land Title Guarantee Company | |
| Caulk Stephen F | $223,000 | Land Title |
Source: Public Records
Mortgage History
| Date | Status | Borrower | Loan Amount |
|---|---|---|---|
| Open | Street Martin P | $235,125 | |
| Previous Owner | Koel Kenneth G | $130,000 | |
| Previous Owner | Caulk Stephen F | $178,400 |
Source: Public Records
Tax History Compared to Growth
Tax History
| Year | Tax Paid | Tax Assessment Tax Assessment Total Assessment is a certain percentage of the fair market value that is determined by local assessors to be the total taxable value of land and additions on the property. | Land | Improvement |
|---|---|---|---|---|
| 2024 | $4,201 | $42,431 | $21,469 | $20,962 |
| 2023 | $4,201 | $42,431 | $21,469 | $20,962 |
| 2022 | $3,332 | $32,994 | $15,836 | $17,158 |
| 2021 | $3,374 | $33,944 | $16,292 | $17,652 |
| 2020 | $3,165 | $31,882 | $15,662 | $16,220 |
| 2019 | $3,126 | $31,882 | $15,662 | $16,220 |
| 2018 | $2,735 | $26,903 | $8,646 | $18,257 |
| 2017 | $2,499 | $26,903 | $8,646 | $18,257 |
| 2016 | $2,502 | $25,948 | $8,428 | $17,520 |
| 2015 | $2,259 | $25,948 | $8,428 | $17,520 |
| 2014 | $2,259 | $21,978 | $7,833 | $14,145 |
Source: Public Records
Map
Nearby Homes
- 1577 S Pierson St
- 1537 S Owens St Unit 31
- 1822 S Robb St
- 1517 S Owens St Unit 5
- 1474 S Pierson St Unit 65
- 10490 W Jewell Ave Unit C
- 10490 W Jewell Ave Unit D
- 10910 W Florida Ave Unit 502
- 1679 S Lee St Unit C
- 11165 W Asbury Ave
- 1659 S Lee St Unit B
- 10430 W Jewell Ave Unit B
- 2154 S Parfet Dr
- 10960 W Florida Ave Unit 104
- 10340 W Jewell Ave Unit C
- 1765 S Kline Way Unit 1765
- 10473 W Arkansas Dr
- 10866 W Evans Ave Unit 56
- 1865 S Union Blvd
- 1847 S Union Blvd Unit 36
- 1720 S Parfet Ct
- 1760 S Parfet Ct
- 10964 W Mexico Dr
- 1733 S Owens St
- 1723 S Owens St
- 1753 S Owens St
- 1781 S Parfet Ct
- 1741 S Parfet Ct
- 1721 S Parfet Ct
- 1761 S Parfet Ct
- 11023 W Mexico Dr
- 11003 W Mexico Dr
- 1763 S Owens St
- 10983 W Mexico Dr
- 10953 W Mexico Dr
- 11043 W Mexico Dr
- 10923 W Mexico Dr
- 10965 W Montana Place
- 10945 W Montana Place
- 11063 W Mexico Dr