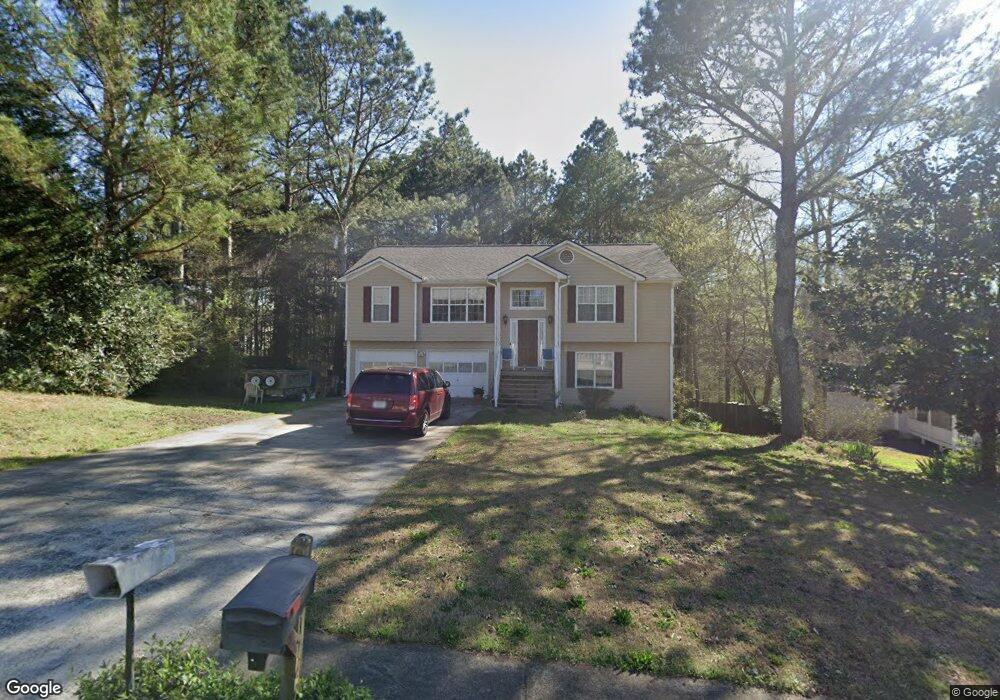
1740 Wynfield Ln Unit 3 Auburn, GA 30011
Estimated Value: $362,327 - $404,000
3
Beds
3
Baths
2,274
Sq Ft
$166/Sq Ft
Est. Value
About This Home
This home is located at 1740 Wynfield Ln Unit 3, Auburn, GA 30011 and is currently estimated at $377,082, approximately $165 per square foot. 1740 Wynfield Ln Unit 3 is a home located in Barrow County with nearby schools including Auburn Elementary School, Westside Middle School, and Apalachee High School.
Ownership History
Date
Name
Owned For
Owner Type
Purchase Details
Closed on
Mar 7, 2003
Sold by
Weaver Mitchell A An
Bought by
Weaver Mitchell A And
Current Estimated Value
Home Financials for this Owner
Home Financials are based on the most recent Mortgage that was taken out on this home.
Original Mortgage
$106,000
Outstanding Balance
$45,503
Interest Rate
5.86%
Mortgage Type
Stand Alone Second
Estimated Equity
$331,579
Purchase Details
Closed on
May 1, 1997
Sold by
Jc G Inc
Bought by
Weaver Mitchell A and Brown Elizabeth L
Home Financials for this Owner
Home Financials are based on the most recent Mortgage that was taken out on this home.
Original Mortgage
$111,078
Interest Rate
8.2%
Mortgage Type
VA
Purchase Details
Closed on
Sep 30, 1996
Sold by
Wynfield Associates
Bought by
J C G Inc
Purchase Details
Closed on
Jun 13, 1996
Sold by
Ado Inc
Bought by
Wynfield Associates
Purchase Details
Closed on
Apr 9, 1996
Bought by
Ado Inc
Create a Home Valuation Report for This Property
The Home Valuation Report is an in-depth analysis detailing your home's value as well as a comparison with similar homes in the area
Home Values in the Area
Average Home Value in this Area
Purchase History
| Date | Buyer | Sale Price | Title Company |
|---|---|---|---|
| Weaver Mitchell A And | -- | -- | |
| Weaver Mitchell A | $108,900 | -- | |
| J C G Inc | -- | -- | |
| Wynfield Associates | -- | -- | |
| Ado Inc | -- | -- |
Source: Public Records
Mortgage History
| Date | Status | Borrower | Loan Amount |
|---|---|---|---|
| Open | Weaver Mitchell A And | $106,000 | |
| Previous Owner | Weaver Mitchell A | $111,078 |
Source: Public Records
Tax History Compared to Growth
Tax History
| Year | Tax Paid | Tax Assessment Tax Assessment Total Assessment is a certain percentage of the fair market value that is determined by local assessors to be the total taxable value of land and additions on the property. | Land | Improvement |
|---|---|---|---|---|
| 2024 | $3,184 | $120,846 | $26,000 | $94,846 |
| 2023 | $2,140 | $120,846 | $26,000 | $94,846 |
| 2022 | $2,365 | $94,232 | $19,200 | $75,032 |
| 2021 | $2,057 | $75,462 | $14,000 | $61,462 |
| 2020 | $2,055 | $75,462 | $14,000 | $61,462 |
| 2019 | $1,924 | $68,678 | $14,000 | $54,678 |
| 2018 | $1,811 | $64,416 | $12,000 | $52,416 |
| 2017 | $272 | $50,993 | $10,400 | $40,593 |
| 2016 | $1,397 | $47,936 | $12,400 | $35,536 |
| 2015 | $1,426 | $48,782 | $12,400 | $36,382 |
| 2014 | $1,220 | $44,156 | $7,350 | $36,806 |
| 2013 | -- | $41,865 | $7,350 | $34,515 |
Source: Public Records
Map
Nearby Homes
- 1778 Wynfield Ln
- 1466 Maston Rd
- 189 Etheridge Rd
- 60 Wood Chuck Ct
- 70 Wood Chuck Ct
- 1923 Westfall Landing
- 331 Wages Rd
- 280 Etheridge Rd
- 335 Wages Rd
- 81 Hills Shop Rd
- 162 Auburn Run Ln
- 114 Auburn Valley Way
- 15 N Auburn Landing Place
- 124 Auburn Woods Dr
- 32 S Auburn Landing Place
- 491 Glen Terrace Rd
- 44 Avian Way
- 44 Avian Way Unit 129B
- 46 Avian Way
- 46 Avian Way Unit 130B
- 1738 Wynfield Ln
- 1742 Wynfield Ln
- 1742 Wynfield Ln Unit 3
- 1736 Wynfield Ln
- 1744 Wynfield Ln
- 1746 Wynfield Ln Unit 3
- 1737 Wynfield Ln
- 1734 Wynfield Ln
- 1748 Wynfield Ln Unit O
- 1748 Wynfield Ln Unit 4
- 1748 Wynfield Ln
- 1749 Wynfield Ln Unit 4
- 1735 Wynfield Ln Unit 3
- 1732 Wynfield Ln Unit 3
- 1750 Wynfield Ln
- 1751 Wynfield Ln
- 1730 Wynfield Ln
- 1730 Wynfield Ln Unit 3
- 1729 Wynfield Ln
- 1571 Wynfield Dr