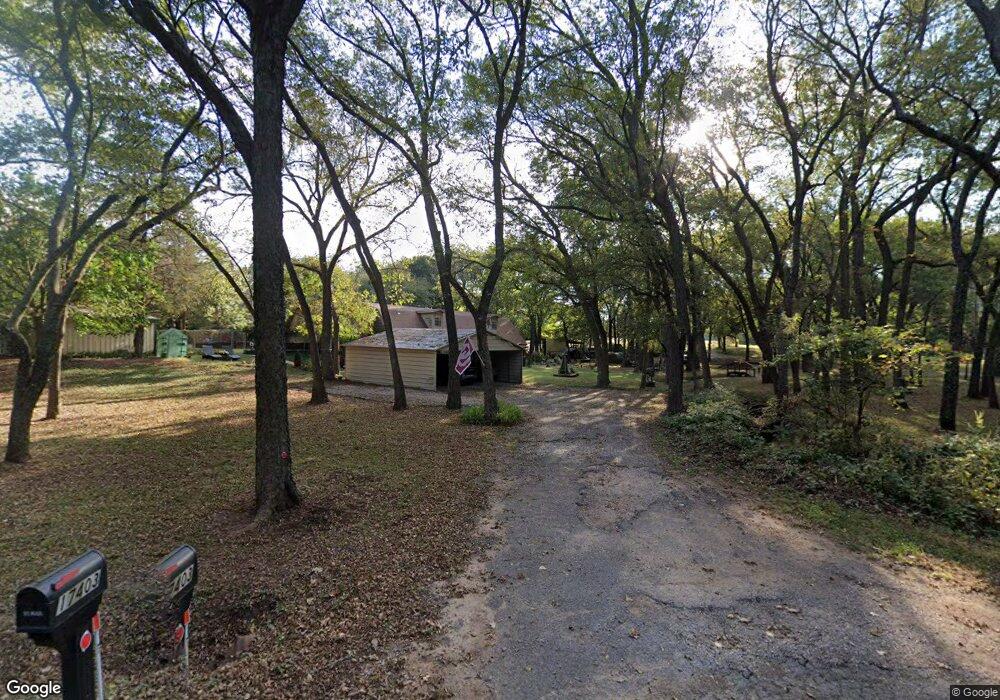
17403 Crosslin Rd Shawnee, OK 74801
Estimated Value: $399,000 - $509,000
3
Beds
2
Baths
3,916
Sq Ft
$120/Sq Ft
Est. Value
About This Home
This home is located at 17403 Crosslin Rd, Shawnee, OK 74801 and is currently estimated at $468,901, approximately $119 per square foot. 17403 Crosslin Rd is a home located in Pottawatomie County with nearby schools including Earlsboro Elementary School and Earlsboro High School.
Ownership History
Date
Name
Owned For
Owner Type
Purchase Details
Closed on
Jan 7, 2020
Sold by
Cash Linda C
Bought by
Cash Charles P and Cash Linda C
Current Estimated Value
Purchase Details
Closed on
Jul 3, 2006
Sold by
Sisco Dale and Sisco Sonia
Bought by
Cash Charles P and Cash Linda C
Home Financials for this Owner
Home Financials are based on the most recent Mortgage that was taken out on this home.
Original Mortgage
$207,920
Outstanding Balance
$121,338
Interest Rate
6.63%
Mortgage Type
New Conventional
Estimated Equity
$347,563
Purchase Details
Closed on
Mar 22, 1996
Sold by
Watson Gary
Bought by
Harvey Sherri
Purchase Details
Closed on
May 31, 1994
Sold by
Dutton Bob and Dutton Allene
Bought by
Harvey Sherri and Watson Ga
Create a Home Valuation Report for This Property
The Home Valuation Report is an in-depth analysis detailing your home's value as well as a comparison with similar homes in the area
Home Values in the Area
Average Home Value in this Area
Purchase History
| Date | Buyer | Sale Price | Title Company |
|---|---|---|---|
| Cash Charles P | -- | None Available | |
| Cash Charles P | $260,000 | None Available | |
| Harvey Sherri | -- | -- | |
| Harvey Sherri | $119,000 | -- |
Source: Public Records
Mortgage History
| Date | Status | Borrower | Loan Amount |
|---|---|---|---|
| Open | Cash Charles P | $207,920 |
Source: Public Records
Tax History Compared to Growth
Tax History
| Year | Tax Paid | Tax Assessment Tax Assessment Total Assessment is a certain percentage of the fair market value that is determined by local assessors to be the total taxable value of land and additions on the property. | Land | Improvement |
|---|---|---|---|---|
| 2025 | $2,206 | $29,795 | $4,200 | $25,595 |
| 2024 | $2,140 | $28,927 | $4,200 | $24,727 |
| 2023 | $2,140 | $28,085 | $4,200 | $23,885 |
| 2022 | $2,444 | $28,085 | $4,200 | $23,885 |
| 2021 | $2,490 | $28,085 | $4,200 | $23,885 |
| 2020 | $2,567 | $28,562 | $4,200 | $24,362 |
| 2019 | $2,699 | $29,516 | $4,200 | $25,316 |
| 2018 | $2,755 | $29,851 | $4,200 | $25,651 |
| 2017 | $2,739 | $30,068 | $4,200 | $25,868 |
| 2016 | $2,688 | $29,192 | $4,200 | $24,992 |
| 2015 | $2,694 | $28,342 | $4,200 | $24,142 |
| 2014 | $2,852 | $29,951 | $4,200 | $25,751 |
Source: Public Records
Map
Nearby Homes
- 48052 River Rd
- 16710 Kings Rd
- 16504 Kings Rd
- 15709 Crosslin Rd
- 18835 Ferdondo Dr
- 4 Hillcrest Dr
- 103 Cody Rd
- 106 Cody Rd
- 45201 Hardesty Rd
- 45210 Hardesty Rd
- 17701 S Rock Creek Rd
- 19553 Crosslin Rd
- 00 S Rock Creek Rd
- 000 E Highland St
- 15809 S Rock Creek Rd
- 00 Allyson Ln
- 49408 River Rd
- 15606 Econtuchka Rd
- 46500 Bob Crouch Rd
- 00 Hardesty Rd 15 Acres
- 17200 Crosslin Rd
- 17501 Crosslin Rd
- 17301 Crosslin Rd
- 46901 River Rd
- 17106 Crosslin Rd
- 46906 Hickory Hollow
- 8 Hickory Hollow
- 46814 Hickory Hollow
- 46967 Hickory Hollow
- 46885 Hickory Hollow
- 46935 Hickory Hollow
- 46819 Hickory Hollow
- 17647 Crosslin Rd
- 17606 Crosslin Rd
- 46739 Hickory Hollow
- 46640 Hickory Hollow
- 46767 Hickory Hollow
- 46659 Hickory Hollow
- 46659 Hickory Hollow
- 17708 Crosslin Rd