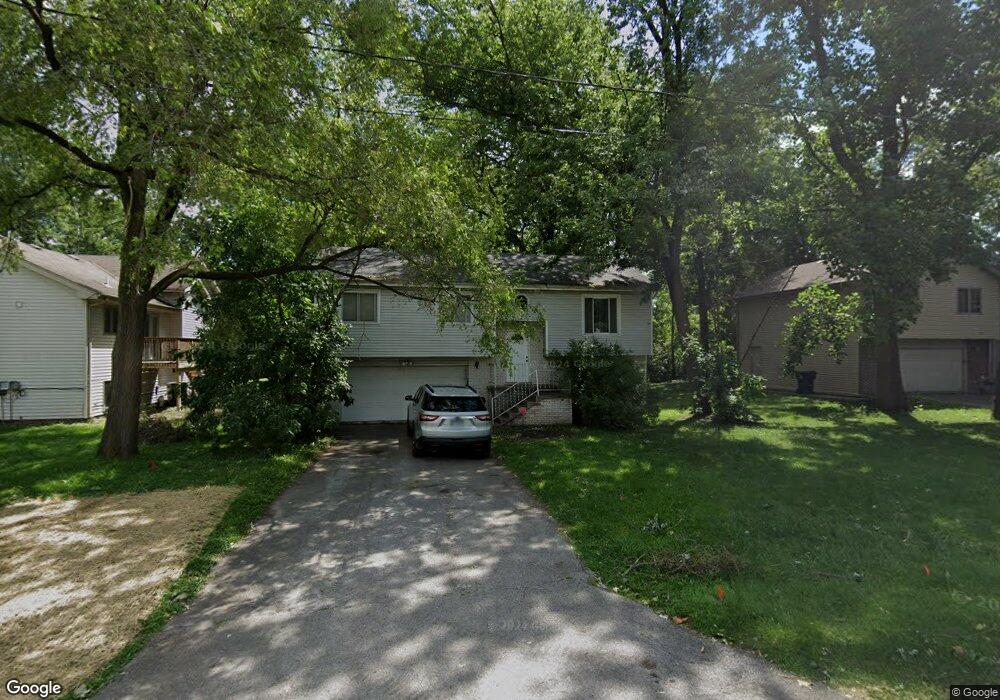
17403 Loomis Ave Hazel Crest, IL 60429
Estimated Value: $225,046 - $332,000
4
Beds
2
Baths
1,774
Sq Ft
$148/Sq Ft
Est. Value
About This Home
This home is located at 17403 Loomis Ave, Hazel Crest, IL 60429 and is currently estimated at $262,012, approximately $147 per square foot. 17403 Loomis Ave is a home located in Cook County with nearby schools including Thornwood High School.
Ownership History
Date
Name
Owned For
Owner Type
Purchase Details
Closed on
Sep 13, 2018
Sold by
Slaughter Phyllis
Bought by
Lightfoot Patrice
Current Estimated Value
Purchase Details
Closed on
Feb 17, 2006
Sold by
Lightfoot Patrice
Bought by
Slaughter Phyllis Y
Home Financials for this Owner
Home Financials are based on the most recent Mortgage that was taken out on this home.
Original Mortgage
$180,000
Interest Rate
8.75%
Mortgage Type
Purchase Money Mortgage
Purchase Details
Closed on
Jun 23, 2005
Sold by
Lightfoot Gary
Bought by
Slaughter Phyllis Y
Purchase Details
Closed on
Sep 24, 2002
Sold by
Andrews Leonard and Andrews Rozalia
Bought by
Lightfoot Gary and Lightfoot Patrice
Home Financials for this Owner
Home Financials are based on the most recent Mortgage that was taken out on this home.
Original Mortgage
$131,750
Interest Rate
10.7%
Mortgage Type
Purchase Money Mortgage
Purchase Details
Closed on
Apr 25, 2000
Sold by
Mikulec Franciszka
Bought by
Andrews Leonard and Andrews Rozalia
Create a Home Valuation Report for This Property
The Home Valuation Report is an in-depth analysis detailing your home's value as well as a comparison with similar homes in the area
Home Values in the Area
Average Home Value in this Area
Purchase History
| Date | Buyer | Sale Price | Title Company |
|---|---|---|---|
| Lightfoot Patrice | -- | None Available | |
| Slaughter Phyllis Y | $180,000 | Cti | |
| Slaughter Phyllis Y | -- | Cti | |
| Lightfoot Gary | $136,000 | -- | |
| Andrews Leonard | -- | -- |
Source: Public Records
Mortgage History
| Date | Status | Borrower | Loan Amount |
|---|---|---|---|
| Previous Owner | Slaughter Phyllis Y | $180,000 | |
| Previous Owner | Lightfoot Gary | $131,750 |
Source: Public Records
Tax History
| Year | Tax Paid | Tax Assessment Tax Assessment Total Assessment is a certain percentage of the fair market value that is determined by local assessors to be the total taxable value of land and additions on the property. | Land | Improvement |
|---|---|---|---|---|
| 2025 | $8,671 | $20,000 | $2,008 | $17,992 |
| 2024 | $8,671 | $20,000 | $2,008 | $17,992 |
| 2023 | $6,596 | $20,000 | $2,008 | $17,992 |
| 2022 | $6,596 | $13,558 | $2,678 | $10,880 |
| 2021 | $6,532 | $13,556 | $2,677 | $10,879 |
| 2020 | $6,405 | $13,556 | $2,677 | $10,879 |
| 2019 | $5,281 | $12,261 | $2,454 | $9,807 |
| 2018 | $5,220 | $12,261 | $2,454 | $9,807 |
| 2017 | $5,282 | $12,261 | $2,454 | $9,807 |
| 2016 | $5,048 | $11,494 | $2,231 | $9,263 |
| 2015 | $4,814 | $11,494 | $2,231 | $9,263 |
| 2014 | $4,751 | $11,494 | $2,231 | $9,263 |
| 2013 | $5,148 | $13,109 | $2,231 | $10,878 |
Source: Public Records
Map
Nearby Homes
- 1307 173rd St
- 1409 172nd St
- 1411 172nd St
- 1514 173rd St
- 1021 173rd St
- 17406 Lathrop Ave
- 1113 171st St
- 17212 Hawthorne Dr
- 17866 Ashland Ave
- 17917 Ashland Ave
- 1624 Burr Oak Rd
- 1812 Cedar Rd
- 17322 Forestway Dr
- 1621 Burr Oak Rd
- 17092 Jodave Ave
- 18000 Armitage Ct
- 17308 Forestway Dr
- 17092 Lincoln St
- 16919 Wood St
- 1465 Ridge Rd
- 17407 Loomis Ave
- 1321 174th St
- 17411 Loomis Ave
- 1401 174th St
- 17406 Loomis Ave
- 17419 Loomis Ave
- 1328 174th St
- 1315 174th St
- 17412 Loomis Ave
- 1329 174th St
- 17421 Loomis Ave
- 1409 174th St
- 1311 174th St
- 17323 Loomis Ave
- 1402 174th St
- 1322 175th St
- 1320 174th St
- 17425 Loomis Ave Unit 2
- 1307 174th St
- 1316 175th St
Your Personal Tour Guide
Ask me questions while you tour the home.