1741 Avalon Dr Unit 1-B Estes Park, CO 80517
Estimated Value: $738,000 - $874,000
2
Beds
2
Baths
2,256
Sq Ft
$348/Sq Ft
Est. Value
About This Home
This home is located at 1741 Avalon Dr Unit 1-B, Estes Park, CO 80517 and is currently estimated at $784,660, approximately $347 per square foot. 1741 Avalon Dr Unit 1-B is a home located in Larimer County with nearby schools including Estes Park K-5 School, Estes Park Options School, and Estes Park Middle School.
Ownership History
Date
Name
Owned For
Owner Type
Purchase Details
Closed on
Nov 12, 2015
Sold by
Myers Marilyn A and Gallagher Patrick Randall
Bought by
Klett Stephen P and Bergman Nancy M
Current Estimated Value
Home Financials for this Owner
Home Financials are based on the most recent Mortgage that was taken out on this home.
Original Mortgage
$310,400
Interest Rate
3.9%
Mortgage Type
New Conventional
Purchase Details
Closed on
Mar 17, 2006
Sold by
Wells Theodore C and Wells Helma S
Bought by
Myers Marilyn A and Gallagher Patrick Randall
Purchase Details
Closed on
Apr 13, 2004
Sold by
Wells Theodore C and Wells Helma S
Bought by
Wells Theodore C and Wells Helma S
Purchase Details
Closed on
May 28, 1999
Sold by
Manske Glen E and Manske Margaret A
Bought by
Wells Theodore C and Wells Helma S
Home Financials for this Owner
Home Financials are based on the most recent Mortgage that was taken out on this home.
Original Mortgage
$208,000
Interest Rate
6.91%
Create a Home Valuation Report for This Property
The Home Valuation Report is an in-depth analysis detailing your home's value as well as a comparison with similar homes in the area
Home Values in the Area
Average Home Value in this Area
Purchase History
| Date | Buyer | Sale Price | Title Company |
|---|---|---|---|
| Klett Stephen P | $388,000 | Rocky Mountain Title | |
| Myers Marilyn A | $378,000 | Security Title | |
| Wells Theodore C | -- | -- | |
| Wells Theodore C | $260,000 | -- |
Source: Public Records
Mortgage History
| Date | Status | Borrower | Loan Amount |
|---|---|---|---|
| Previous Owner | Klett Stephen P | $310,400 | |
| Previous Owner | Wells Theodore C | $208,000 |
Source: Public Records
Tax History Compared to Growth
Tax History
| Year | Tax Paid | Tax Assessment Tax Assessment Total Assessment is a certain percentage of the fair market value that is determined by local assessors to be the total taxable value of land and additions on the property. | Land | Improvement |
|---|---|---|---|---|
| 2025 | $3,690 | $54,069 | $1,474 | $52,595 |
| 2024 | $3,627 | $54,069 | $1,474 | $52,595 |
| 2022 | $2,657 | $34,799 | $1,529 | $33,270 |
| 2021 | $2,728 | $35,800 | $1,573 | $34,227 |
| 2020 | $2,671 | $34,606 | $1,573 | $33,033 |
| 2019 | $2,656 | $34,606 | $1,573 | $33,033 |
| 2018 | $2,331 | $29,448 | $1,584 | $27,864 |
| 2017 | $2,343 | $29,448 | $1,584 | $27,864 |
| 2016 | $2,514 | $33,480 | $1,751 | $31,729 |
| 2015 | $2,540 | $33,480 | $1,750 | $31,730 |
| 2014 | $2,247 | $30,380 | $1,750 | $28,630 |
Source: Public Records
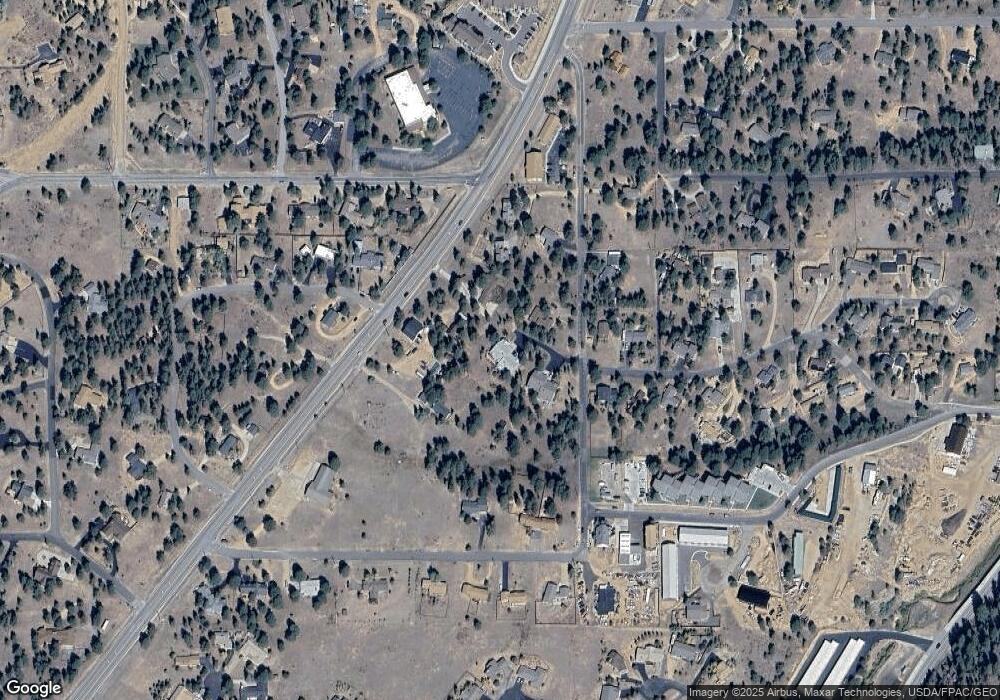
Map
Nearby Homes
- 930 Highacres Dr
- 1230 Brook Dr
- 1323 Brook Dr
- 1033 Tranquil Ln
- 1341 Tall Pines Dr
- 0 Governors Ln Unit 1035838
- 1062 Pine Knoll Dr
- 1250 S Saint Vrain Ave Unit 11
- 1155 S Saint Vrain Ave Unit 1-3
- 1155 S Saint Vrain Ave Unit 3
- 2175 Carriage Dr
- 1141 Fairway Club Cir Unit C3
- 1132 Fairway Club Ln Unit 2
- 2408 Longview Dr
- 1111 Fairway Club Cir Unit 4
- 2319 Spruce Ave
- 405 Pawnee Dr
- 407 Pawnee Dr
- 1026 Lexington Ln
- 659 Peak View Dr
- 1741 Avalon Dr Unit B1
- 1743 Avalon Dr Unit B2
- 1750 S Saint Vrain Ave
- 1745 Avalon Dr
- 1731 Avalon Dr
- 1747 Avalon Dr Unit A2
- 1747 Avalon Dr Unit 2
- 1740 S Saint Vrain Ave
- 1655 Avalon Dr
- 1720 Avalon Dr
- 1641 Avalon Dr
- 1110 Brook Dr
- 1778 Avalon Dr
- 1109 Brook Dr
- 1650 Avalon Dr
- 1635 Avalon Dr
- 951 Highacres Dr
- 1130 Brook Dr
- 1041 Acacia Dr
- 1061 Acacia Dr Unit A