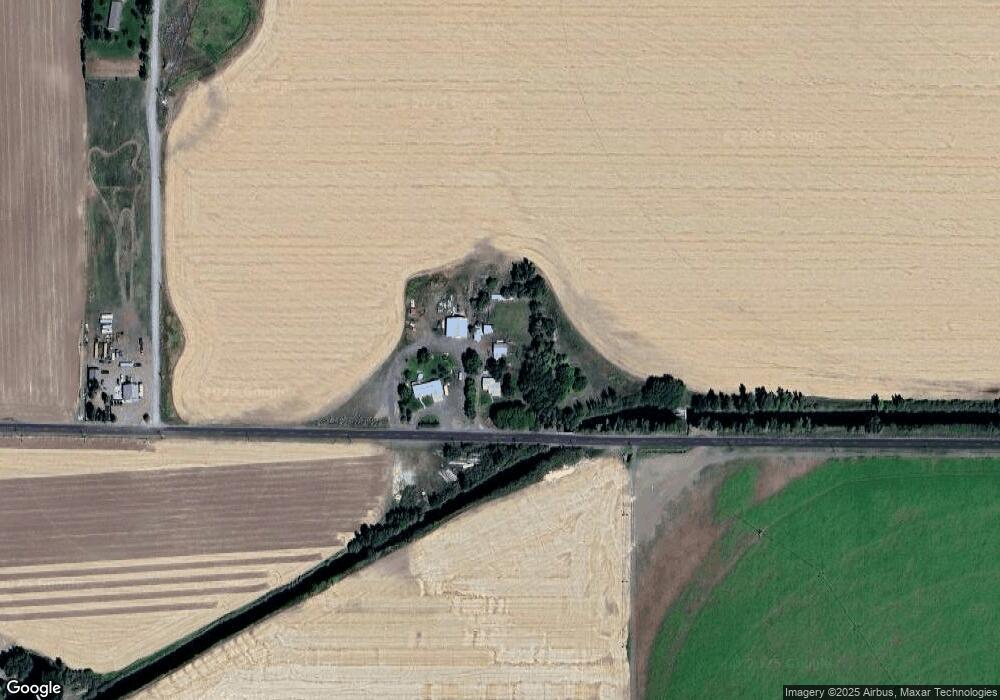
1741 E 500 N Saint Anthony, ID 83445
Estimated Value: $319,000 - $674,000
3
Beds
1
Bath
1,476
Sq Ft
$289/Sq Ft
Est. Value
About This Home
This home is located at 1741 E 500 N, Saint Anthony, ID 83445 and is currently estimated at $426,329, approximately $288 per square foot. 1741 E 500 N is a home located in Fremont County with nearby schools including Parker-Egin Elementary School, South Fremont Junior High School, and South Fremont High School.
Ownership History
Date
Name
Owned For
Owner Type
Purchase Details
Closed on
Jul 18, 2018
Sold by
Quayle Ernest Y and Quayle Ernest Young
Bought by
Goebel Inday Joy and Goebel Dallas
Current Estimated Value
Home Financials for this Owner
Home Financials are based on the most recent Mortgage that was taken out on this home.
Original Mortgage
$131,313
Outstanding Balance
$113,802
Interest Rate
4.5%
Mortgage Type
New Conventional
Estimated Equity
$312,527
Create a Home Valuation Report for This Property
The Home Valuation Report is an in-depth analysis detailing your home's value as well as a comparison with similar homes in the area
Home Values in the Area
Average Home Value in this Area
Purchase History
| Date | Buyer | Sale Price | Title Company |
|---|---|---|---|
| Goebel Inday Joy | -- | Amerititle Idaho Falls |
Source: Public Records
Mortgage History
| Date | Status | Borrower | Loan Amount |
|---|---|---|---|
| Open | Goebel Inday Joy | $131,313 |
Source: Public Records
Tax History Compared to Growth
Tax History
| Year | Tax Paid | Tax Assessment Tax Assessment Total Assessment is a certain percentage of the fair market value that is determined by local assessors to be the total taxable value of land and additions on the property. | Land | Improvement |
|---|---|---|---|---|
| 2025 | $661 | $126,048 | $60,150 | $65,898 |
| 2024 | $661 | $123,946 | $60,150 | $63,796 |
| 2023 | $629 | $123,946 | $60,150 | $63,796 |
| 2022 | $823 | $102,123 | $50,150 | $51,973 |
| 2021 | $758 | $69,332 | $31,820 | $37,512 |
| 2020 | $761 | $65,127 | $31,820 | $33,307 |
| 2019 | $753 | $65,127 | $31,820 | $33,307 |
| 2018 | $752 | $61,342 | $31,820 | $29,522 |
| 2017 | $8 | $58,897 | $30,865 | $28,032 |
| 2016 | $832 | $58,897 | $30,865 | $28,032 |
| 2015 | $821 | $108,349 | $0 | $0 |
| 2014 | $627 | $58,897 | $0 | $0 |
| 2013 | $627 | $58,781 | $0 | $0 |
Source: Public Records
Map
Nearby Homes