1741 Elvan Ave Unit . B Columbus, GA 31903
Southern Columbus NeighborhoodAbout This Home
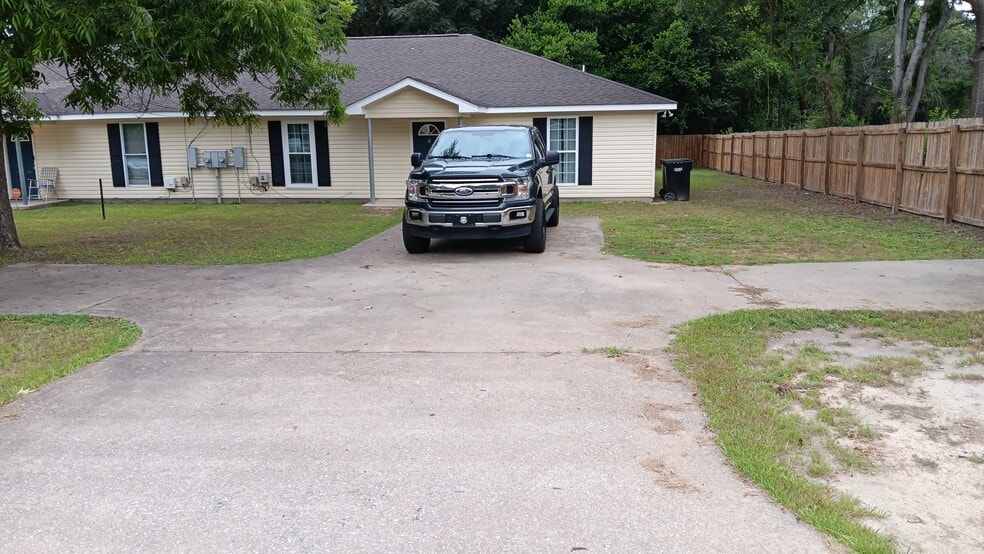
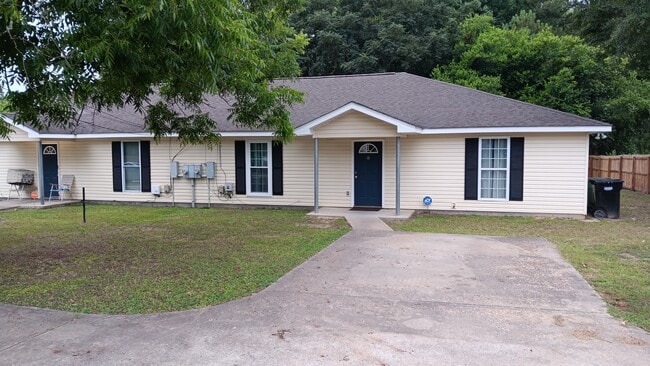
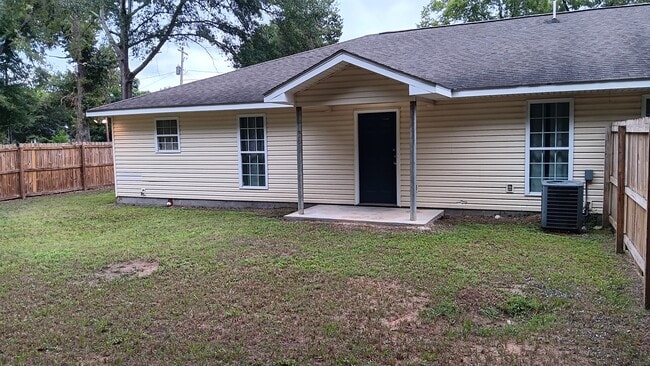
Welcome to your new home at 1741 Elvan Ave, Apt A in Columbus, GA! This charming 3-bedroom, 2-bathroom house boasts 1,480 square feet of comfortable living space, perfect for those looking to settle down in a vibrant community.
Step inside to discover a well-equipped kitchen featuring modern amenities, including an electric range, exhaust hood, refrigerator, and washer & dryer hookups. The spacious layout provides plenty of room for relaxation and entertaining, making it an ideal choice for anyone seeking a cozy yet functional space.
Additional highlights of this property include:
- 3 spacious bedrooms for restful nights
- 2 full bathrooms for convenience
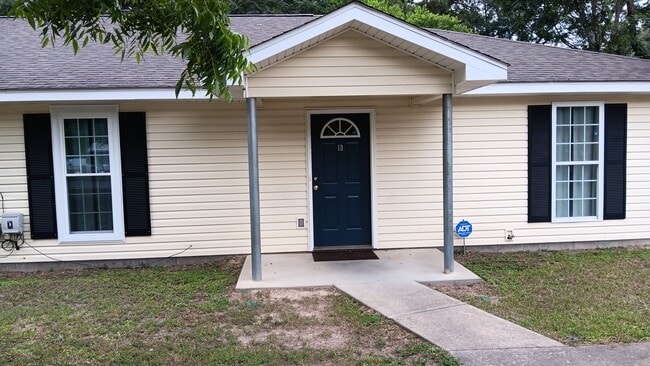
- A welcoming atmosphere in a good neighborhood
This home is close to shopping centers, dining, and outlets. You can find major shopping, dining, and other services all within less than a mile. Access to public transit is also very close.
Cats and small dogs under 15lbs. are permitted with Pet Deposit (limit 2 pets total).
NO SMOKING INDOORS!!!
Mark your calendars for showings starting October 20, 2025, and get ready to make this lovely house your new home!
Preferred lease duration is 1 year. This property is unfurnished.

Map
- 2973 Hawthorne Dr
- 2451 Brownie Ln
- 1274 Providence Ln
- 2463 Brownie Ln
- 2102 Somerset Ave
- 2203 Simmons Ave
- 2353 Shelby St
- 3042 Colonial Dr
- 7 Esquiline Dr
- 3009 Plantation Rd
- 13 Esquiline Dr
- 15 Lowe Dr
- 38 Douglas St
- 37 Muscogee Dr
- 122 Torch Hill Rd
- 3015 Hendrix St
- 2333 Bruce Ave
- 2320 Fort Benning Rd
- 20 Patch Dr
- 2463 Brownie St
- 1741 Elvan Ave
- 2001 Torch Hill Rd
- 2830 Ramsey Rd
- 1312 Gazebo Way
- 121 Torch Hill Rd
- 21 Patch Dr
- 39 Ticknor Dr
- 54 Ticknor Dr
- 1983 Monaco Dr
- 1986 Monaco Dr Unit ID1043808P
- 1127 Club House Rd
- 77 Engineer Dr Unit A
- 77 Engineer Dr
- 72 Artillery Dr
- 1529 Brazil Ave Unit ID1043836P
- 2080 Shelby St
- 3390 N Lumpkin Rd Unit 1101
- 3390 N Lumpkin Rd Unit 1206
- 3390 N Lumpkin Rd
- 3150 Plateau Dr Unit 423