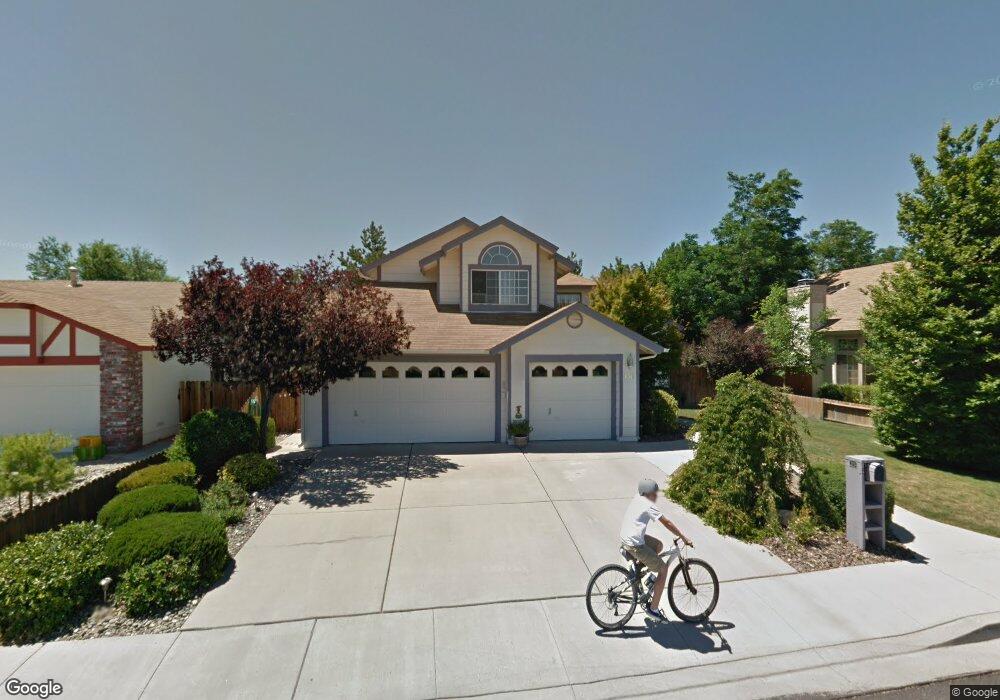
1741 Glen Oaks Dr Reno, NV 89523
Northgate NeighborhoodEstimated Value: $690,000 - $741,000
4
Beds
3
Baths
2,276
Sq Ft
$310/Sq Ft
Est. Value
About This Home
This home is located at 1741 Glen Oaks Dr, Reno, NV 89523 and is currently estimated at $704,683, approximately $309 per square foot. 1741 Glen Oaks Dr is a home located in Washoe County with nearby schools including B D Billinghurst Middle School, Robert McQueen High School, and The King's Academy.
Ownership History
Date
Name
Owned For
Owner Type
Purchase Details
Closed on
Mar 21, 2006
Sold by
Sundland A Wrede
Bought by
Sundland Pierre
Current Estimated Value
Home Financials for this Owner
Home Financials are based on the most recent Mortgage that was taken out on this home.
Original Mortgage
$100,000
Outstanding Balance
$56,783
Interest Rate
6.25%
Mortgage Type
Credit Line Revolving
Estimated Equity
$647,900
Purchase Details
Closed on
Mar 13, 1998
Sold by
Sundland Annette
Bought by
Sundland Pierre
Home Financials for this Owner
Home Financials are based on the most recent Mortgage that was taken out on this home.
Original Mortgage
$164,800
Outstanding Balance
$30,388
Interest Rate
7.11%
Estimated Equity
$674,295
Purchase Details
Closed on
Jul 29, 1996
Sold by
Clark Scott B and Clark Sandra G
Bought by
Powell Susan J and Markwell Angela I
Home Financials for this Owner
Home Financials are based on the most recent Mortgage that was taken out on this home.
Original Mortgage
$193,300
Interest Rate
8.42%
Create a Home Valuation Report for This Property
The Home Valuation Report is an in-depth analysis detailing your home's value as well as a comparison with similar homes in the area
Home Values in the Area
Average Home Value in this Area
Purchase History
| Date | Buyer | Sale Price | Title Company |
|---|---|---|---|
| Sundland Pierre | -- | North American Title Co | |
| Sundland Pierre | -- | First American Title Co | |
| Sundland Pierre | $206,000 | First American Title Co | |
| Powell Susan J | $203,500 | -- |
Source: Public Records
Mortgage History
| Date | Status | Borrower | Loan Amount |
|---|---|---|---|
| Open | Sundland Pierre | $100,000 | |
| Open | Sundland Pierre | $164,800 | |
| Previous Owner | Powell Susan J | $193,300 |
Source: Public Records
Tax History Compared to Growth
Tax History
| Year | Tax Paid | Tax Assessment Tax Assessment Total Assessment is a certain percentage of the fair market value that is determined by local assessors to be the total taxable value of land and additions on the property. | Land | Improvement |
|---|---|---|---|---|
| 2025 | $2,616 | $105,579 | $41,396 | $64,182 |
| 2024 | $2,542 | $99,338 | $33,948 | $65,390 |
| 2023 | $2,542 | $100,054 | $37,606 | $62,448 |
| 2022 | $2,466 | $84,226 | $31,887 | $52,339 |
| 2021 | $2,395 | $77,886 | $25,436 | $52,450 |
| 2020 | $2,323 | $78,382 | $25,470 | $52,912 |
| 2019 | $2,261 | $76,854 | $25,470 | $51,384 |
| 2018 | $2,190 | $69,026 | $18,786 | $50,240 |
| 2017 | $2,127 | $68,177 | $17,589 | $50,588 |
| 2016 | $2,068 | $67,156 | $16,725 | $50,431 |
| 2015 | $2,064 | $64,904 | $14,264 | $50,640 |
| 2014 | $1,990 | $61,166 | $12,303 | $48,863 |
| 2013 | -- | $52,640 | $9,210 | $43,430 |
Source: Public Records
Map
Nearby Homes
- 1664 Shadow Wood Rd
- 1836 Cambridge Hills Ct
- 6811 Sonterra Ln
- 6460 Valley Wood Dr
- 1651 Ashbury Ln
- 6368 Springwood Dr
- 6673 Enchanted Valley Dr
- 6220 Valley Wood Dr
- 6440 Enchanted Valley Dr
- 1055 Udowski Unit Homesite 53
- 1025 Udowski Unit Homesite 56
- 0 Unit 250003854
- 2014 Cradle Mountain Dr Unit 2
- 2163 3 Wood Ln
- 6357 Moon Ridge Terrace
- 1931 E Minaret Cir
- 2365 Red Maple Ct
- 1770 Amarak Way
- 6339 Park Place
- 1410 Crosswater Dr
- 1731 Glen Oaks Dr
- 1761 Glen Oaks Dr
- 1721 Glen Oaks Dr
- 6575 Starfire Ln
- 1771 Glen Oaks Dr
- 1711 Glen Oaks Dr
- 6760 Diamond Glen Dr
- 6780 Diamond Glen Dr Unit 18A
- 6555 Starfire Ln
- 6790 Diamond Glen Dr Unit 18A
- 6750 Diamond Glen Dr
- 1691 Glen Oaks Dr
- 1781 Glen Oaks Dr
- 6576 Starfire Ln
- 1771 Albright Ct
- 1765 Albright Ct
- 6535 Starfire Ln
- 6740 Diamond Glen Dr
- 1698 Glen Oaks Dr
- 1671 Glen Oaks Dr