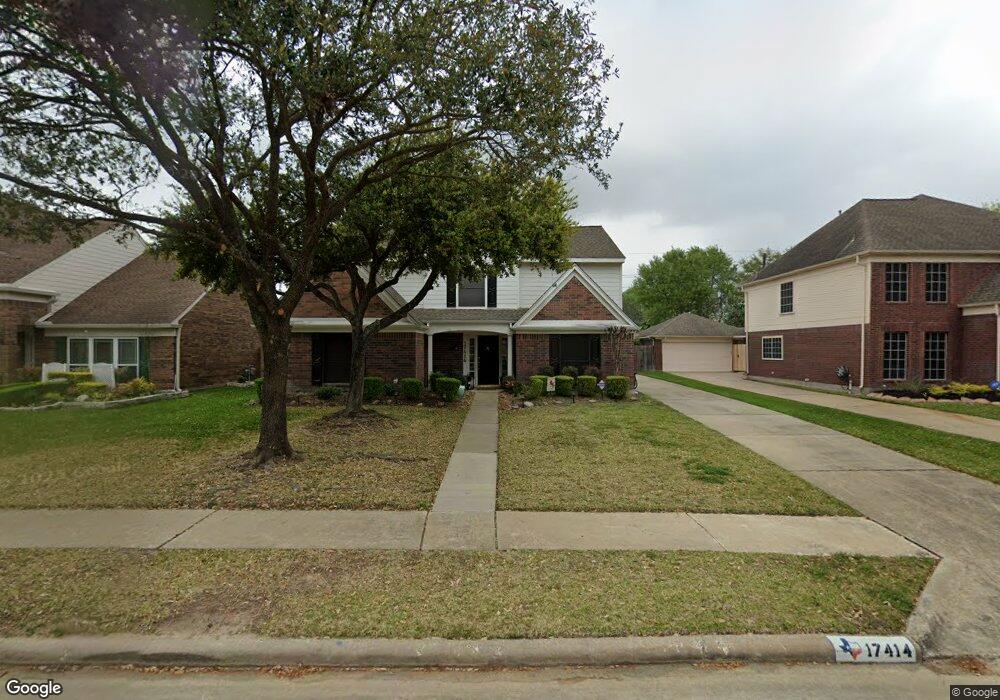
17414 Emerald Isle Dr Houston, TX 77095
Copperfield NeighborhoodEstimated Value: $359,806 - $405,000
5
Beds
4
Baths
2,696
Sq Ft
$143/Sq Ft
Est. Value
About This Home
This home is located at 17414 Emerald Isle Dr, Houston, TX 77095 and is currently estimated at $384,452, approximately $142 per square foot. 17414 Emerald Isle Dr is a home located in Harris County with nearby schools including Copeland Elementary School, Aragon Middle School, and Langham Creek High School.
Ownership History
Date
Name
Owned For
Owner Type
Purchase Details
Closed on
Feb 26, 2014
Sold by
Srp Sub Llc
Bought by
Tarbert Llc
Current Estimated Value
Purchase Details
Closed on
Dec 6, 2012
Sold by
Melendez Jose F and Melendez Susie
Bought by
Srp Sub Llc
Purchase Details
Closed on
Nov 12, 2010
Sold by
Leblanc Johnny A and Leblanc Robin D
Bought by
Melendez Jose F and Melendez Susie
Purchase Details
Closed on
Jul 16, 2008
Sold by
Czerniakowski Peter J and Czerniakowski Mary Elizabeth
Bought by
Leblanc Johnny A and Leblanc Robin D
Home Financials for this Owner
Home Financials are based on the most recent Mortgage that was taken out on this home.
Original Mortgage
$18,550
Interest Rate
6.4%
Mortgage Type
Stand Alone Second
Create a Home Valuation Report for This Property
The Home Valuation Report is an in-depth analysis detailing your home's value as well as a comparison with similar homes in the area
Home Values in the Area
Average Home Value in this Area
Purchase History
| Date | Buyer | Sale Price | Title Company |
|---|---|---|---|
| Tarbert Llc | -- | -- | |
| Tarbert Llc | -- | -- | |
| Srp Sub Llc | -- | None Available | |
| Melendez Jose F | -- | Startex Title Company 04 | |
| Leblanc Johnny A | -- | Chicago Title |
Source: Public Records
Mortgage History
| Date | Status | Borrower | Loan Amount |
|---|---|---|---|
| Previous Owner | Leblanc Johnny A | $18,550 | |
| Previous Owner | Leblanc Johnny A | $148,800 |
Source: Public Records
Tax History Compared to Growth
Tax History
| Year | Tax Paid | Tax Assessment Tax Assessment Total Assessment is a certain percentage of the fair market value that is determined by local assessors to be the total taxable value of land and additions on the property. | Land | Improvement |
|---|---|---|---|---|
| 2025 | $7,657 | $332,060 | $68,700 | $263,360 |
| 2024 | $7,657 | $346,140 | $68,700 | $277,440 |
| 2023 | $7,657 | $348,930 | $68,700 | $280,230 |
| 2022 | $7,704 | $327,171 | $49,072 | $278,099 |
| 2021 | $6,473 | $261,942 | $49,072 | $212,870 |
| 2020 | $5,844 | $228,331 | $37,748 | $190,583 |
| 2019 | $6,062 | $231,317 | $37,748 | $193,569 |
| 2018 | $3,096 | $215,000 | $37,748 | $177,252 |
| 2017 | $5,654 | $218,600 | $37,748 | $180,852 |
| 2016 | $5,654 | $218,600 | $37,748 | $180,852 |
| 2015 | $4,489 | $220,000 | $37,748 | $182,252 |
| 2014 | $4,489 | $198,939 | $31,708 | $167,231 |
Source: Public Records
Map
Nearby Homes
- 17310 Crescent Canyon Dr
- 17518 Rustling Aspen Ln
- 7807 Hickory Mill Ct
- 17710 Noble Oak Ct
- 7626 Almond Springs Dr
- 17603 Fairgrove Park Dr
- 17214 Palm Falls Ct
- 17814 Stoney Glade Ct
- 8410 Castle Pond Ct
- 7810 Timberline Run Ln
- 17326 Masonridge Dr
- 8507 Forest Arbor Ct
- 8519 Sunrise Meadow Ln
- 17522 Masonridge Dr
- 17531 Cypress Laurel St
- 17010 Poplar Hill St
- 8411 Sandestine Ct
- 7539 Wildwood Brook Ct
- 17222 Crown Meadow Ct
- 17523 Hamilwood Dr
- 17410 Emerald Isle Dr
- 17418 Emerald Isle Dr
- 17406 Emerald Isle Dr
- 17422 Emerald Isle Dr
- 17106 Crescent Canyon Dr
- 7910 Grand Mountain Ct
- 17426 Emerald Isle Dr
- 17402 Emerald Isle Dr
- 17122 Highland Canyon Dr
- 7911 Grand Mountain Ct
- 17107 Crescent Canyon Dr
- 17210 Highland Canyon Dr
- 17118 Highland Canyon Dr
- 17110 Crescent Canyon Dr
- 17430 Emerald Isle Dr
- 7906 Grand Mountain Ct
- 7902 Grand Mountain Ct
- 7907 Grand Mountain Ct
- 7910 Gulf Isle Ct
- 17114 Highland Canyon Dr