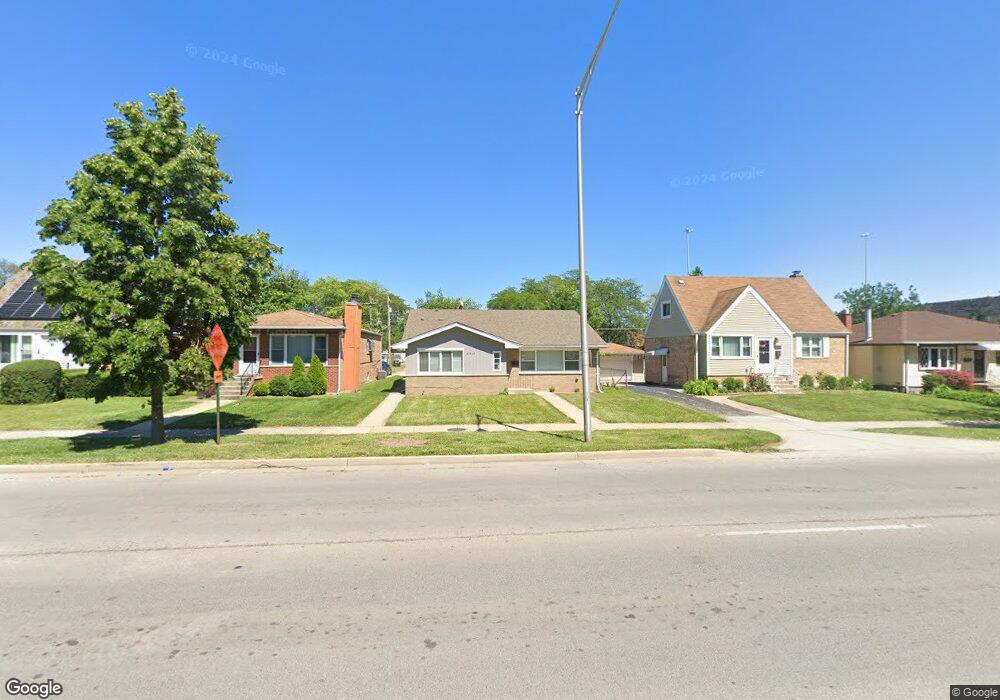
17415 Burnham Ave Lansing, IL 60438
Estimated Value: $190,000 - $201,000
3
Beds
2
Baths
1,200
Sq Ft
$162/Sq Ft
Est. Value
About This Home
This home is located at 17415 Burnham Ave, Lansing, IL 60438 and is currently estimated at $194,255, approximately $161 per square foot. 17415 Burnham Ave is a home located in Cook County with nearby schools including Reavis Elementary School, Memorial Jr High School, and Thornton Fractnl So High School.
Ownership History
Date
Name
Owned For
Owner Type
Purchase Details
Closed on
Nov 24, 2025
Sold by
Cerberus Sfr Holdings Ii Lp and Fkh Sfr Ci Lp
Bought by
Bets Kenyetta
Current Estimated Value
Home Financials for this Owner
Home Financials are based on the most recent Mortgage that was taken out on this home.
Original Mortgage
$190,500
Outstanding Balance
$190,500
Interest Rate
6.19%
Mortgage Type
New Conventional
Estimated Equity
$3,755
Purchase Details
Closed on
Jun 6, 2018
Sold by
Tinley Park Associates Llc
Bought by
Cerberus Sfr Holdings Ii L P
Purchase Details
Closed on
Sep 14, 2012
Sold by
Mack Investments I Llc
Bought by
Tinley Park Associates Llc
Purchase Details
Closed on
Jun 15, 2012
Sold by
U S Bank National Association
Bought by
Mack Investments 1 Llc
Purchase Details
Closed on
Apr 27, 2012
Sold by
Luna Osvaldo
Bought by
U S Bank National Association
Create a Home Valuation Report for This Property
The Home Valuation Report is an in-depth analysis detailing your home's value as well as a comparison with similar homes in the area
Home Values in the Area
Average Home Value in this Area
Purchase History
| Date | Buyer | Sale Price | Title Company |
|---|---|---|---|
| Bets Kenyetta | $200,000 | None Listed On Document | |
| Bets Kenyetta | $200,000 | None Listed On Document | |
| Cerberus Sfr Holdings Ii L P | $104,000 | Fidelity National Title | |
| Cerberus Sfr Holdings Ii L P | $104,000 | Fidelity National Title | |
| Tinley Park Associates Llc | $125,000 | None Available | |
| Tinley Park Associates Llc | $125,000 | None Available | |
| Mack Investments 1 Llc | $36,000 | Multiple | |
| Mack Investments 1 Llc | $36,000 | Multiple | |
| U S Bank National Association | -- | None Available | |
| U S Bank National Association | -- | None Available |
Source: Public Records
Mortgage History
| Date | Status | Borrower | Loan Amount |
|---|---|---|---|
| Open | Bets Kenyetta | $190,500 |
Source: Public Records
Tax History
| Year | Tax Paid | Tax Assessment Tax Assessment Total Assessment is a certain percentage of the fair market value that is determined by local assessors to be the total taxable value of land and additions on the property. | Land | Improvement |
|---|---|---|---|---|
| 2025 | $2,661 | $5,500 | $1,040 | $4,460 |
| 2024 | $2,661 | $5,500 | $1,040 | $4,460 |
| 2023 | $2,525 | $5,500 | $1,040 | $4,460 |
| 2022 | $2,525 | $3,886 | $910 | $2,976 |
| 2021 | $2,996 | $4,740 | $910 | $3,830 |
| 2020 | $2,781 | $4,740 | $910 | $3,830 |
| 2019 | $2,356 | $4,139 | $845 | $3,294 |
| 2018 | $1,652 | $4,674 | $845 | $3,829 |
| 2017 | $1,685 | $4,674 | $845 | $3,829 |
| 2016 | $1,865 | $4,659 | $780 | $3,879 |
| 2015 | $1,826 | $4,906 | $780 | $4,126 |
| 2014 | $1,815 | $4,906 | $780 | $4,126 |
| 2013 | $1,313 | $4,230 | $780 | $3,450 |
Source: Public Records
Map
Nearby Homes
- 17423 Walter St
- 17318 Walter St
- 17518 Roy St
- 17303 Roy St
- 17335 Community St
- 17552 Roy St
- 17519 Community St
- 17617 Burnham Ave
- 3018 Bernice Rd Unit 205
- 3425 Bernice Ave
- 17226 Community St
- 17303 Chicago Ave
- 17153 Walter St
- 17132 Walter St
- 17714 Burnham Ave
- 2938 173rd Place
- 2937 172nd St
- 17056 Burnham Ave
- 3238 178th St
- 17057 Park Ave
- 17415 Burnham Ave
- 17411 Burnham Ave
- 17421 Burnham Ave
- 17421 Burnham Ave
- 17421 Burnham Ave
- 17409 Burnham Ave
- 17409 Burnham Ave
- 17403 Burnham Ave
- 17403 Burnham Ave
- 17427 Burnham Ave
- 3215 Bernice Rd
- 17416 Walter St
- 17422 Walter St
- 17422 Walter St
- 17433 Burnham Ave
- 17406 Walter St
- 17414 Burnham Ave
- 17430 Walter St
- 17416 Burnham Ave
- 17416 Burnham Ave
Your Personal Tour Guide
Ask me questions while you tour the home.