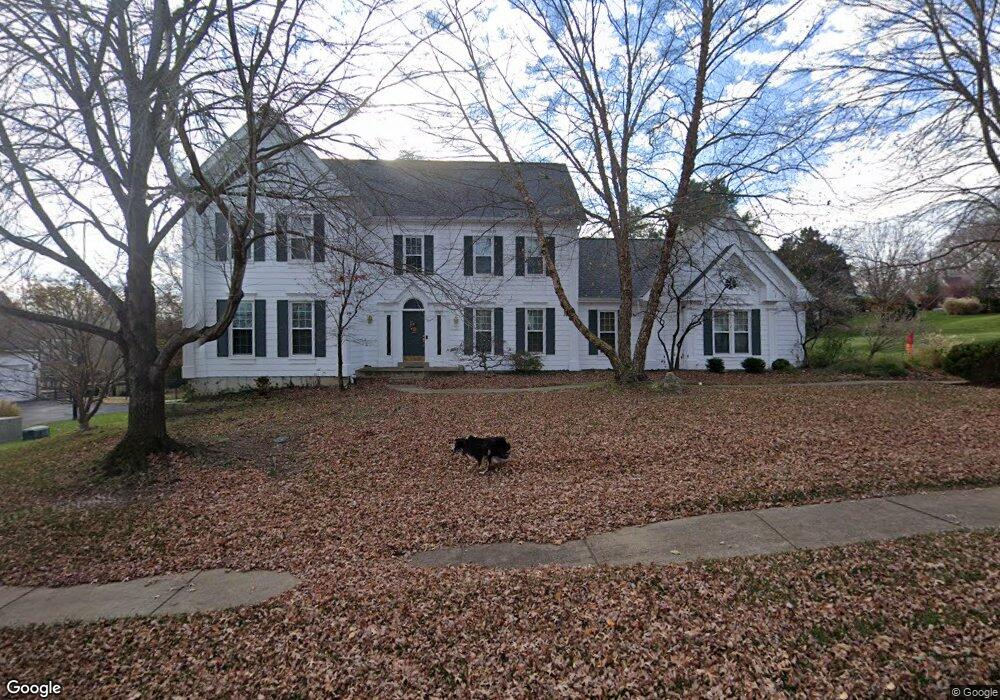
17416 Emily Way Ct Chesterfield, MO 63005
Estimated Value: $770,174 - $901,000
4
Beds
4
Baths
3,313
Sq Ft
$252/Sq Ft
Est. Value
About This Home
This home is located at 17416 Emily Way Ct, Chesterfield, MO 63005 and is currently estimated at $835,294, approximately $252 per square foot. 17416 Emily Way Ct is a home located in St. Louis County with nearby schools including Chesterfield Elementary School, Rockwood Valley Middle School, and Lafayette High School.
Ownership History
Date
Name
Owned For
Owner Type
Purchase Details
Closed on
Mar 1, 2005
Sold by
Garrett Claude N and Garrett Susan W
Bought by
Garrett Claude N and Garrett Susan W
Current Estimated Value
Purchase Details
Closed on
Jan 7, 2002
Sold by
Lamear Nancy S and Lamear Anthony L
Bought by
Garrett Claude N and Garrett Susan W
Home Financials for this Owner
Home Financials are based on the most recent Mortgage that was taken out on this home.
Original Mortgage
$270,000
Outstanding Balance
$110,256
Interest Rate
7.03%
Estimated Equity
$725,038
Purchase Details
Closed on
Aug 6, 1999
Sold by
Carroll Richard and Farlow Nancy A
Bought by
Lamear Anthony L and Lamear Nancy S
Home Financials for this Owner
Home Financials are based on the most recent Mortgage that was taken out on this home.
Original Mortgage
$328,500
Interest Rate
6.75%
Create a Home Valuation Report for This Property
The Home Valuation Report is an in-depth analysis detailing your home's value as well as a comparison with similar homes in the area
Home Values in the Area
Average Home Value in this Area
Purchase History
| Date | Buyer | Sale Price | Title Company |
|---|---|---|---|
| Garrett Claude N | -- | -- | |
| Garrett Claude N | $410,000 | -- | |
| Lamear Anthony L | $365,000 | -- |
Source: Public Records
Mortgage History
| Date | Status | Borrower | Loan Amount |
|---|---|---|---|
| Open | Garrett Claude N | $270,000 | |
| Previous Owner | Lamear Anthony L | $328,500 |
Source: Public Records
Tax History Compared to Growth
Tax History
| Year | Tax Paid | Tax Assessment Tax Assessment Total Assessment is a certain percentage of the fair market value that is determined by local assessors to be the total taxable value of land and additions on the property. | Land | Improvement |
|---|---|---|---|---|
| 2025 | $7,912 | $118,490 | $40,530 | $77,960 |
| 2024 | $7,912 | $111,490 | $20,270 | $91,220 |
| 2023 | $7,706 | $111,490 | $20,270 | $91,220 |
| 2022 | $7,077 | $95,210 | $22,520 | $72,690 |
| 2021 | $7,036 | $95,210 | $22,520 | $72,690 |
| 2020 | $6,286 | $82,130 | $20,270 | $61,860 |
| 2019 | $6,251 | $82,130 | $20,270 | $61,860 |
| 2018 | $6,352 | $78,700 | $18,010 | $60,690 |
| 2017 | $6,209 | $78,700 | $18,010 | $60,690 |
| 2016 | $7,310 | $89,030 | $20,270 | $68,760 |
| 2015 | $7,156 | $89,030 | $20,270 | $68,760 |
| 2014 | $6,860 | $83,390 | $19,740 | $63,650 |
Source: Public Records
Map
Nearby Homes
- 17643 Wildridge Dr
- 16908 Lewis Spring Farms Rd
- 1631 Highland Valley Cir
- 1577 Kehrs Mill Rd
- 1230 Wildhorse Parkway Dr
- 17609 Burnham Ct
- 17707 Hornbean Dr
- 6 Kehrs Mill Glen Ct
- 1475 Country Lake Estates Dr
- 1419 Carriage Crossing Ln
- 1556 Wildhorse Parkway Dr
- 1504 Kehrs Mill Rd
- 17702 Horse Creek Ct
- 17421 Private Valley Ln
- 16499 Horseshoe Ridge Rd
- 17106 Chaise Ridge Rd
- 2167 Wildwood Meadows Ct
- 17283 Courtyard Mill Ln
- 1315 Wildhorse Meadows Dr
- 17707 Wild Horse Creek Rd
- 17408 Emily Way Ct
- 17468 Highland Way Dr
- 17480 Highland Way Dr
- 17484 Highland Way Dr
- 17417 Emily Way Ct
- 17456 Highland Way Dr
- 17409 Emily Way Ct
- 17400 Emily Way Ct
- 17488 Highland Way Dr
- 17434 Highland Way Dr
- 17401 Emily Way Ct
- 17479 Highland Way Dr
- 17506 Adams Way Ct
- 17426 Highland Way Dr
- 17418 Highland Way Dr
- 17489 Highland Way Dr
- 17492 Highland Way Dr
- 17471 Highland Way Dr
- 17463 Highland Way Dr
- 17447 Highland Way Dr