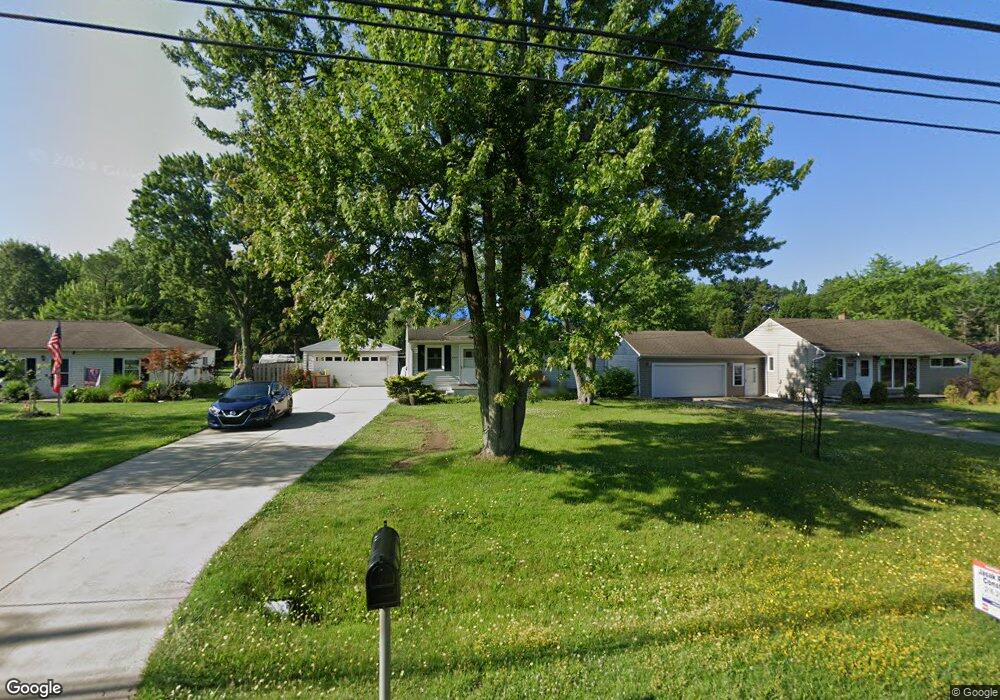
17419 Fowles Rd Middleburg Heights, OH 44130
Estimated Value: $185,467 - $239,000
3
Beds
1
Bath
888
Sq Ft
$235/Sq Ft
Est. Value
About This Home
This home is located at 17419 Fowles Rd, Middleburg Heights, OH 44130 and is currently estimated at $208,617, approximately $234 per square foot. 17419 Fowles Rd is a home located in Cuyahoga County with nearby schools including Big Creek Elementary School, Berea-Midpark Middle School, and Berea-Midpark High School.
Ownership History
Date
Name
Owned For
Owner Type
Purchase Details
Closed on
Dec 18, 2020
Sold by
Mccarthy Debra J
Bought by
Durczak Gerald
Current Estimated Value
Home Financials for this Owner
Home Financials are based on the most recent Mortgage that was taken out on this home.
Original Mortgage
$110,953
Outstanding Balance
$98,957
Interest Rate
2.8%
Mortgage Type
FHA
Estimated Equity
$109,660
Purchase Details
Closed on
Jun 6, 2007
Sold by
Dahl Dorothy M
Bought by
Mccarthy David F and Mccarthy Debra J
Home Financials for this Owner
Home Financials are based on the most recent Mortgage that was taken out on this home.
Original Mortgage
$105,600
Interest Rate
7%
Mortgage Type
New Conventional
Purchase Details
Closed on
Jul 5, 1979
Sold by
Dahl John A and Dahl Dorothy M
Bought by
Dahl John A
Purchase Details
Closed on
Jan 1, 1975
Bought by
Dahl John A and Dahl Dorothy M
Create a Home Valuation Report for This Property
The Home Valuation Report is an in-depth analysis detailing your home's value as well as a comparison with similar homes in the area
Home Values in the Area
Average Home Value in this Area
Purchase History
| Date | Buyer | Sale Price | Title Company |
|---|---|---|---|
| Durczak Gerald | $113,000 | Newman Title | |
| Mccarthy David F | $132,000 | Max | |
| Dahl John A | -- | -- | |
| Dahl John A | -- | -- |
Source: Public Records
Mortgage History
| Date | Status | Borrower | Loan Amount |
|---|---|---|---|
| Open | Durczak Gerald | $110,953 | |
| Previous Owner | Mccarthy David F | $105,600 |
Source: Public Records
Tax History Compared to Growth
Tax History
| Year | Tax Paid | Tax Assessment Tax Assessment Total Assessment is a certain percentage of the fair market value that is determined by local assessors to be the total taxable value of land and additions on the property. | Land | Improvement |
|---|---|---|---|---|
| 2024 | $3,193 | $59,290 | $16,310 | $42,980 |
| 2023 | $3,494 | $54,040 | $13,160 | $40,880 |
| 2022 | $3,471 | $54,040 | $13,160 | $40,880 |
| 2021 | $3,452 | $54,040 | $13,160 | $40,880 |
| 2020 | $3,458 | $46,590 | $11,340 | $35,250 |
| 2019 | $3,363 | $133,100 | $32,400 | $100,700 |
| 2018 | $3,738 | $46,590 | $11,340 | $35,250 |
| 2017 | $3,808 | $41,830 | $10,220 | $31,610 |
| 2016 | $3,784 | $41,830 | $10,220 | $31,610 |
| 2015 | $3,440 | $41,830 | $10,220 | $31,610 |
| 2014 | $3,440 | $39,450 | $9,630 | $29,820 |
Source: Public Records
Map
Nearby Homes
- 16691 Craigmere Dr
- 7400 Engle Rd
- 16347 Craigmere Dr
- 7381 Grant Blvd
- 16365 Barriemore Ave
- 7344 Engle Rd
- 7470 Lanier Dr
- 7475 Lanier Dr
- 7254 Craigmere Dr
- 15861 Glenridge Ave
- 7221 Craigmere Dr
- 19419 Fowles Rd
- 18737 Evergreen Dr
- 7364 Pearl Rd
- 18203 Broxton Dr
- 7280 Pearl Rd
- 18433 Whitney Rd
- 16147 Ramona Dr
- 7432 Baldwin Creek Dr
- 159 Eastland Rd
- 17449 Fowles Rd
- 17379 Fowles Rd
- 7589 Big Creek Pkwy
- 17349 Fowles Rd
- 7597 Big Creek Pkwy
- 17430 Fowles Rd
- 7603 Big Creek Pkwy
- 17470 Fowles Rd
- 17400 Fowles Rd
- 17309 Fowles Rd
- 7587 Big Creek Pkwy
- 7607 Big Creek Pkwy
- 17370 Fowles Rd
- 17279 Fowles Rd
- 17330 Fowles Rd
- 7615 Big Creek Pkwy
- 7577 Big Creek Pkwy
- 7619 Big Creek Pkwy
- 17300 Fowles Rd
- 7575 Big Creek Pkwy