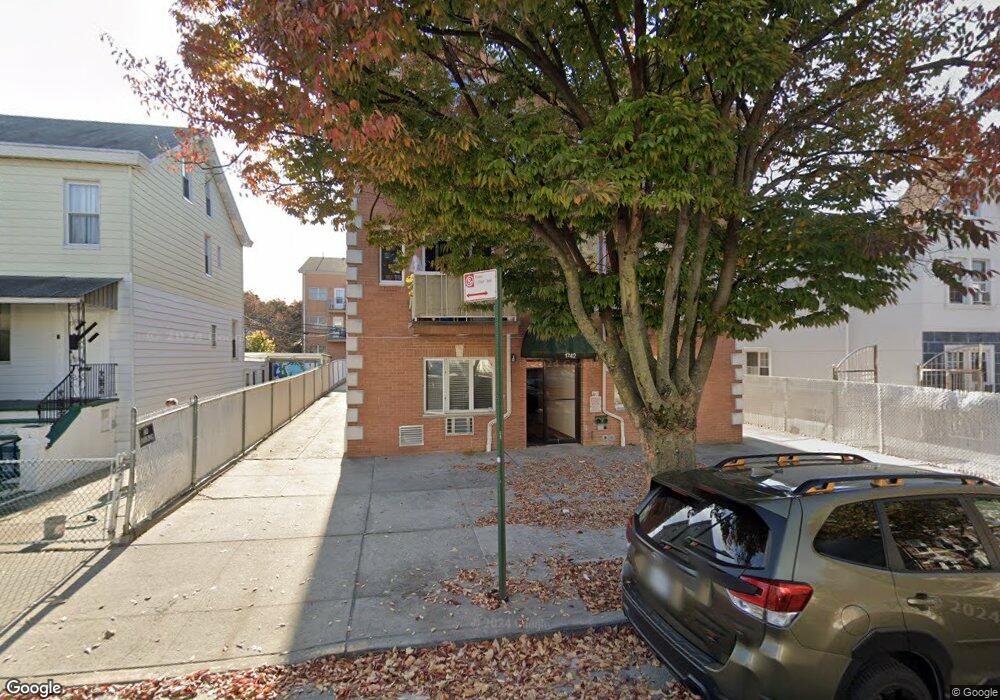
1742 80th St Unit 2A Brooklyn, NY 11214
Bensonhurst NeighborhoodEstimated Value: $691,000 - $968,000
--
Bed
--
Bath
950
Sq Ft
$828/Sq Ft
Est. Value
About This Home
This home is located at 1742 80th St Unit 2A, Brooklyn, NY 11214 and is currently estimated at $786,200, approximately $827 per square foot. 1742 80th St Unit 2A is a home located in Kings County with nearby schools including P.S. 204 Vince Lombardi, IS 201 Madeleine Brennan Intermediate School, and New Utrecht High School.
Ownership History
Date
Name
Owned For
Owner Type
Purchase Details
Closed on
Aug 31, 2016
Sold by
Michaels Charles
Bought by
Huang Li Mei
Current Estimated Value
Home Financials for this Owner
Home Financials are based on the most recent Mortgage that was taken out on this home.
Original Mortgage
$420,000
Outstanding Balance
$336,018
Interest Rate
3.48%
Mortgage Type
Purchase Money Mortgage
Estimated Equity
$450,182
Purchase Details
Closed on
Jan 17, 2014
Sold by
Boyko Mykhaylo
Bought by
Michaels Charles
Purchase Details
Closed on
Aug 19, 2004
Sold by
Grinberg Maksim
Bought by
Boyko Mykhaylo and Savchuk Marta
Home Financials for this Owner
Home Financials are based on the most recent Mortgage that was taken out on this home.
Original Mortgage
$277,500
Interest Rate
6.01%
Mortgage Type
Purchase Money Mortgage
Purchase Details
Closed on
Oct 2, 2003
Sold by
Bath Beach Llc
Bought by
Grinberg Maksim and Grinberg Radmila
Create a Home Valuation Report for This Property
The Home Valuation Report is an in-depth analysis detailing your home's value as well as a comparison with similar homes in the area
Home Values in the Area
Average Home Value in this Area
Purchase History
| Date | Buyer | Sale Price | Title Company |
|---|---|---|---|
| Huang Li Mei | $578,000 | -- | |
| Michaels Charles | $530,000 | -- | |
| Boyko Mykhaylo | $370,000 | -- | |
| Grinberg Maksim | $319,410 | -- |
Source: Public Records
Mortgage History
| Date | Status | Borrower | Loan Amount |
|---|---|---|---|
| Open | Huang Li Mei | $420,000 | |
| Previous Owner | Boyko Mykhaylo | $277,500 |
Source: Public Records
Tax History Compared to Growth
Tax History
| Year | Tax Paid | Tax Assessment Tax Assessment Total Assessment is a certain percentage of the fair market value that is determined by local assessors to be the total taxable value of land and additions on the property. | Land | Improvement |
|---|---|---|---|---|
| 2025 | $7,480 | $62,857 | $2,609 | $60,248 |
| 2024 | $7,480 | $49,649 | $2,609 | $47,040 |
| 2023 | $7,119 | $43,883 | $2,609 | $41,274 |
| 2022 | $6,579 | $40,460 | $2,609 | $37,851 |
| 2021 | $6,532 | $35,244 | $2,609 | $32,635 |
| 2020 | $3,246 | $35,665 | $2,609 | $33,056 |
| 2019 | $6,443 | $35,181 | $2,609 | $32,572 |
| 2018 | $5,079 | $30,379 | $2,006 | $28,373 |
| 2017 | $3,754 | $28,660 | $2,043 | $26,617 |
| 2016 | $2,528 | $27,039 | $1,980 | $25,059 |
| 2015 | $416 | $27,039 | $1,954 | $25,085 |
| 2014 | $416 | $26,835 | $2,327 | $24,508 |
Source: Public Records
Map
Nearby Homes
- 1764 79th St
- 1748 79th St
- 1738 79th St
- 8001 New Utrecht Ave
- 8001 18th Ave
- 1726 79th St
- 1812 80th St
- 1717 79th St
- 1717 78th St
- 8160 Bay 16th St
- 1740 77th St
- 1845 82nd St Unit C-3
- 1859 80th St
- 1827 78th St Unit 1B
- 1687 83rd St
- 1833 78th St
- 7706 17th Ave
- 1722 84th St Unit 203
- 1722 84th St Unit 201
- 1722 84th St Unit 101
- 1742 80th St Unit 3B
- 1742 80th St Unit 2B
- 1742 80th St Unit 1B
- 1742 80th St Unit 1A
- 1742 80 St Unit 1B
- 1742 80 St Unit 3B
- 1736 80th St
- 1752 80th St
- 1738 80th St
- 1754 80th St
- 1732 80th St
- 1730 80th St
- 1743 81st St Unit 2-B
- 1743 81st St
- 1743 81 St Unit LL
- 1743 81 St
- 1758 80th St
- 1751 81st St
- 1737 81st St
- 1737 81st St Unit P1