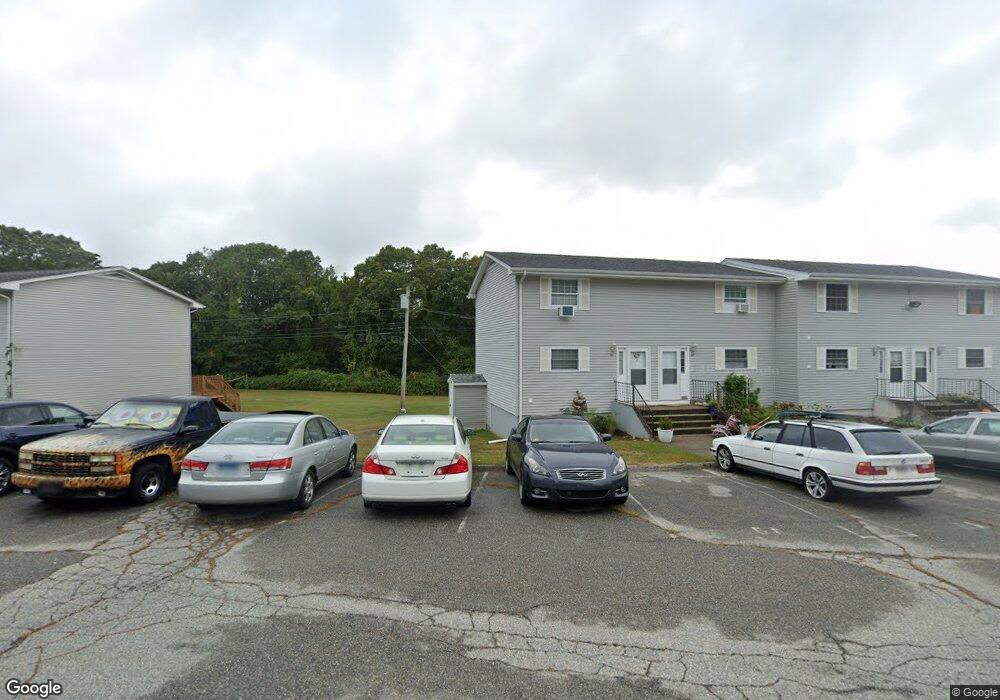
1742 Route 12 Unit 2F Gales Ferry, CT 06335
Estimated Value: $180,546 - $198,000
2
Beds
1
Bath
936
Sq Ft
$200/Sq Ft
Est. Value
About This Home
This home is located at 1742 Route 12 Unit 2F, Gales Ferry, CT 06335 and is currently estimated at $186,887, approximately $199 per square foot. 1742 Route 12 Unit 2F is a home located in New London County with nearby schools including Ledyard Middle School, Ledyard High School, and Academy Of St Therese.
Ownership History
Date
Name
Owned For
Owner Type
Purchase Details
Closed on
Dec 29, 2010
Sold by
Fnma
Bought by
Tian Tammy and Guo Wei
Current Estimated Value
Purchase Details
Closed on
Sep 21, 2010
Sold by
Citimortgage Inc
Bought by
Federal National Mortgage Association
Purchase Details
Closed on
Jan 25, 2008
Sold by
Lichner Brant A and Lichner Jillain M
Bought by
Chandler Ernest H and Chandler Lexie M
Home Financials for this Owner
Home Financials are based on the most recent Mortgage that was taken out on this home.
Original Mortgage
$134,000
Interest Rate
6.17%
Purchase Details
Closed on
Dec 15, 2005
Sold by
Wu Chun Hong
Bought by
Lichner Brant A
Home Financials for this Owner
Home Financials are based on the most recent Mortgage that was taken out on this home.
Original Mortgage
$23,700
Interest Rate
6.34%
Purchase Details
Closed on
Jan 2, 2003
Sold by
Mlm Developmetns Inc
Bought by
Wu Chungmong
Create a Home Valuation Report for This Property
The Home Valuation Report is an in-depth analysis detailing your home's value as well as a comparison with similar homes in the area
Home Values in the Area
Average Home Value in this Area
Purchase History
| Date | Buyer | Sale Price | Title Company |
|---|---|---|---|
| Tian Tammy | -- | -- | |
| Federal National Mortgage Association | -- | -- | |
| Chandler Ernest H | $134,000 | -- | |
| Lichner Brant A | $474,000 | -- | |
| Wu Chungmong | $73,000 | -- |
Source: Public Records
Mortgage History
| Date | Status | Borrower | Loan Amount |
|---|---|---|---|
| Previous Owner | Wu Chungmong | $134,000 | |
| Previous Owner | Wu Chungmong | $23,700 | |
| Previous Owner | Wu Chungmong | $94,800 |
Source: Public Records
Tax History Compared to Growth
Tax History
| Year | Tax Paid | Tax Assessment Tax Assessment Total Assessment is a certain percentage of the fair market value that is determined by local assessors to be the total taxable value of land and additions on the property. | Land | Improvement |
|---|---|---|---|---|
| 2025 | $1,711 | $46,060 | $0 | $46,060 |
| 2024 | $1,622 | $46,060 | $0 | $46,060 |
| 2023 | $1,592 | $46,060 | $0 | $46,060 |
| 2022 | $1,558 | $46,060 | $0 | $46,060 |
| 2021 | $1,548 | $46,060 | $0 | $46,060 |
| 2020 | $1,398 | $39,970 | $0 | $39,970 |
| 2019 | $1,401 | $39,970 | $0 | $39,970 |
| 2018 | $1,371 | $39,970 | $0 | $39,970 |
| 2017 | $1,301 | $39,970 | $0 | $39,970 |
| 2016 | $1,275 | $39,970 | $0 | $39,970 |
| 2015 | $1,215 | $39,970 | $0 | $39,970 |
| 2014 | $2,028 | $67,830 | $0 | $67,830 |
Source: Public Records
Map
Nearby Homes
- 2 Garden Ct
- 47 Norman Dr
- 0 Clarks Falls Unit 24089817
- 9 West Dr
- 123A Whalehead Rd
- 170 Depot Rd
- 7 Harvard Rd
- 421 Kitemaug Rd
- 5 Ledgewood Dr
- 14 Woodland Ln
- 16 Marty's Way
- 7 Briarwood Ct
- 36 Depot Rd
- 31 Richard Rd
- 932 Long Cove Rd Unit TRLR 4
- 165 Massapeag Rd
- 245 Norwich New London Turnpike Unit 22
- 197 Norwich-New London Turnpike
- 127 Massapeag Rd
- 11 Marty's Way
- 1742 Route 12 Unit 4A
- 1742 Route 12 Unit 3F
- 1742 Route 12 Unit 3D
- 1742 Route 12 Unit 4B
- 1742 Route 12 Unit 5E
- 1742 Route 12 Unit 6E
- 1742 Route 12 Unit 5A
- 1742 Route 12 Unit 5B
- 1742 Route 12 Unit 2D
- 1742 Route 12 Unit 3H
- 1742 Route 12 Unit 1D
- 1742 Route 12 Unit 3C
- 1742 Route 12 Unit 1A
- 1742 Route 12 Unit 4C
- 1742 Route 12 Unit 3A
- 1742 Route 12 Unit 5F
- 1742 Route 12 Unit 1E
- 1742 Route 12 Unit 6G
- 1742 Route 12 Unit 3G
- 1742 Route 12 Unit 5C