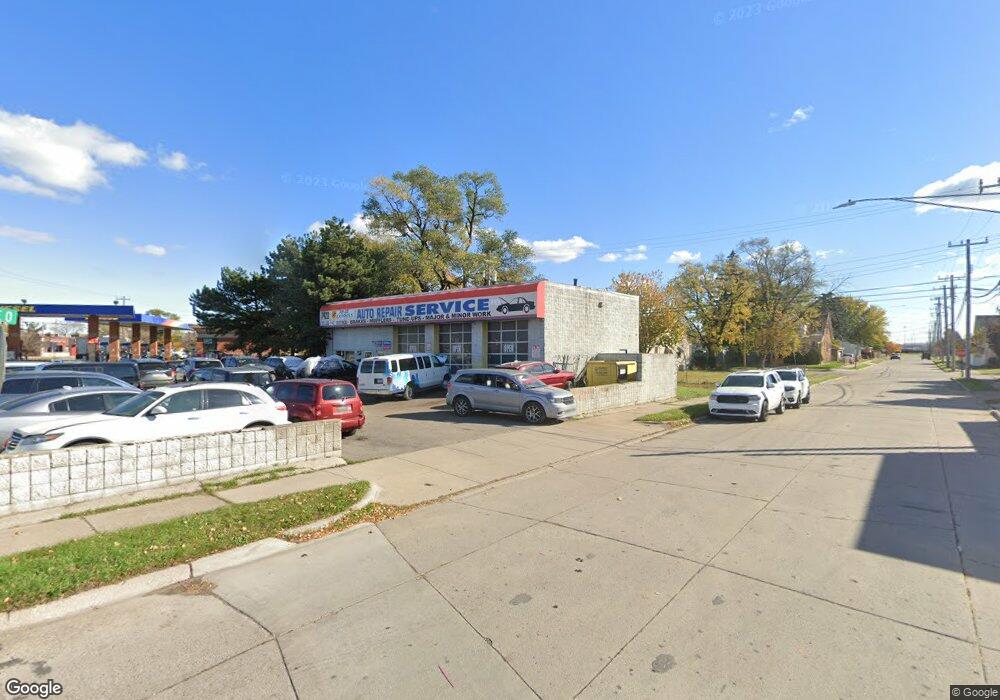
17420 Dix Rd Melvindale, MI 48122
Estimated Value: $161,373
Studio
--
Bath
2,275
Sq Ft
$71/Sq Ft
Est. Value
About This Home
This home is located at 17420 Dix Rd, Melvindale, MI 48122 and is currently estimated at $161,373, approximately $70 per square foot. 17420 Dix Rd is a home located in Wayne County with nearby schools including Rogers Early Elementary School, Allendale Elementary School, and Julian O. Strong Middle School.
Ownership History
Date
Name
Owned For
Owner Type
Purchase Details
Closed on
Mar 4, 2022
Sold by
Moufid Hourani
Bought by
Abdulla Abdul-Kader
Current Estimated Value
Purchase Details
Closed on
Jan 10, 2019
Sold by
Hourani Moufid Diab
Bought by
Abdulla Abdul Kader
Home Financials for this Owner
Home Financials are based on the most recent Mortgage that was taken out on this home.
Original Mortgage
$120,000
Interest Rate
4.7%
Mortgage Type
Seller Take Back
Purchase Details
Closed on
Sep 28, 2017
Sold by
Hourani Nessrain
Bought by
Hourani Moufid Diab
Purchase Details
Closed on
Dec 9, 2011
Sold by
Chahrour Mohamad M
Bought by
Hourani Nessrin
Purchase Details
Closed on
Aug 18, 2011
Sold by
Hourani Nessrin
Bought by
Chahrour Mohamad M and Hourani Nessrin
Purchase Details
Closed on
Nov 10, 2010
Sold by
Abla Group Llc
Bought by
Dearborn Federal Savings Bank
Purchase Details
Closed on
Dec 18, 2001
Sold by
Ahaleb Al Zein
Bought by
Alba Group
Create a Home Valuation Report for This Property
The Home Valuation Report is an in-depth analysis detailing your home's value as well as a comparison with similar homes in the area
Home Values in the Area
Average Home Value in this Area
Purchase History
| Date | Buyer | Sale Price | Title Company |
|---|---|---|---|
| Abdulla Abdul-Kader | $120,000 | None Listed On Document | |
| Abdulla Abdul Kader | -- | None Available | |
| Hourani Moufid Diab | -- | None Available | |
| Hourani Nessrin | -- | None Available | |
| Chahrour Mohamad M | -- | Minnesota Title Agency | |
| Dearborn Federal Savings Bank | $174,000 | None Available | |
| Alba Group | -- | -- |
Source: Public Records
Mortgage History
| Date | Status | Borrower | Loan Amount |
|---|---|---|---|
| Previous Owner | Abdulla Abdul Kader | $120,000 |
Source: Public Records
Tax History Compared to Growth
Tax History
| Year | Tax Paid | Tax Assessment Tax Assessment Total Assessment is a certain percentage of the fair market value that is determined by local assessors to be the total taxable value of land and additions on the property. | Land | Improvement |
|---|---|---|---|---|
| 2025 | $6,205 | $90,200 | $0 | $0 |
| 2024 | $6,430 | $95,300 | $0 | $0 |
| 2023 | $6,198 | $93,300 | $0 | $0 |
| 2022 | $9,014 | $86,800 | $0 | $0 |
| 2021 | $10,508 | $103,000 | $0 | $0 |
| 2020 | $11,498 | $105,300 | $0 | $0 |
| 2019 | $10,035 | $107,900 | $0 | $0 |
| 2018 | $6,753 | $112,400 | $0 | $0 |
| 2017 | $5,863 | $112,300 | $0 | $0 |
| 2016 | $9,471 | $109,000 | $0 | $0 |
| 2015 | $11,100 | $111,000 | $0 | $0 |
| 2013 | $10,800 | $108,000 | $0 | $0 |
| 2012 | $6,869 | $108,000 | $18,300 | $89,700 |
Source: Public Records
Map
Nearby Homes
- 17206 Flora St
- 17083 Dora St
- 3525 Whitaker Dr Unit 68
- 3511 Elizabeth St
- 3595 Elizabeth St
- 17565 Reed St
- 0002 Prospect St
- 0001 Prospect St
- 17951 Prospect St
- 2735 Margaret St
- 17632 Henry St
- 17450 Wood St
- 17646 Wood St
- 17964 Henry St
- 12836 Conway St
- 2573 Grace St
- 18948 Wall St
- 2790 Blanche St
- 17345 Hanna St
- 17621 Hanna St
- 17500 Dix Rd
- 17501 Clarann St
- 0 Dix Rd
- 0 Dix Rd Unit 911566
- 17375 Clarann St
- 17381 Clarann St
- 17367 Clarann St
- 17359 Clarann St
- 17529 Clarann St
- 0 Clarann Unit 4921681
- 0 Clarann Unit 4921682
- 0 Clarann Unit 213058115
- 0 Clarann Unit 213058108
- 17386 Clarann St
- 17537 Clarann St
- 17400 Clarann St
- 17510 Clarann St
- 17380 Clarann St
- 17370 Clarann St
- 17520 Clarann St