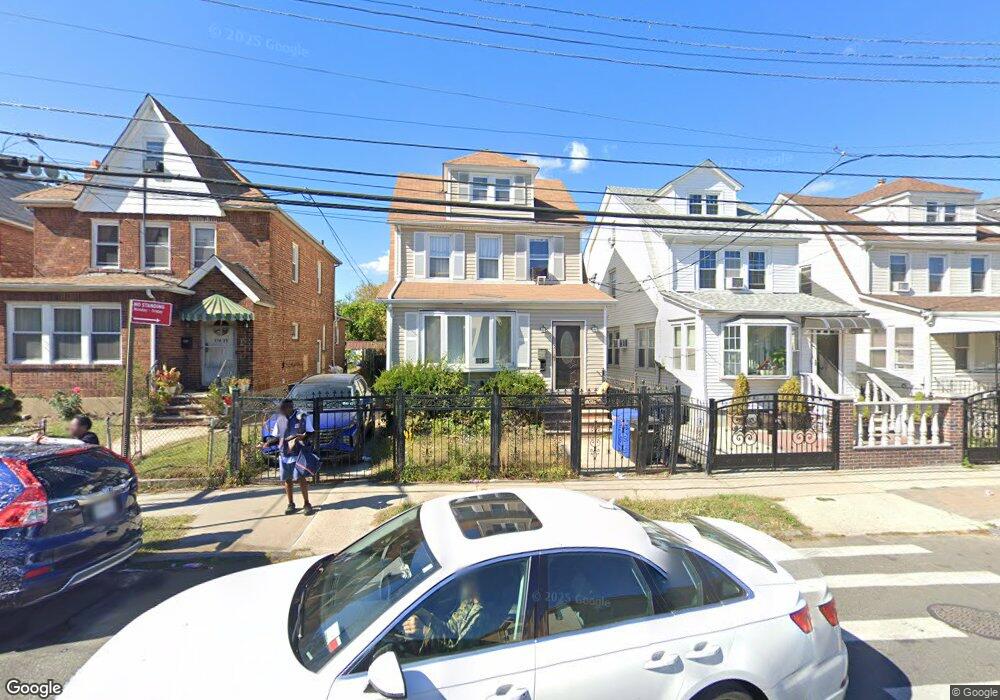
17423 Polhemus Ave Jamaica, NY 11433
Jamaica NeighborhoodEstimated Value: $671,000 - $902,000
--
Bed
--
Bath
1,677
Sq Ft
$454/Sq Ft
Est. Value
About This Home
This home is located at 17423 Polhemus Ave, Jamaica, NY 11433 and is currently estimated at $760,685, approximately $453 per square foot. 17423 Polhemus Ave is a home located in Queens County with nearby schools including P.S./I.S. 116 William C Hughley and I.S. 238 Susan B Anthony Academy.
Ownership History
Date
Name
Owned For
Owner Type
Purchase Details
Closed on
Mar 18, 2024
Sold by
Stevens Ronald and Stevens Shirley
Bought by
Ashraf Anisha and Ashraf Snigdha Aninda
Current Estimated Value
Home Financials for this Owner
Home Financials are based on the most recent Mortgage that was taken out on this home.
Original Mortgage
$397,650
Outstanding Balance
$391,365
Interest Rate
6.9%
Mortgage Type
Purchase Money Mortgage
Estimated Equity
$369,320
Purchase Details
Closed on
Dec 17, 2003
Sold by
Stevens Ronald
Bought by
Stevens Ronald and Stevens Shirley
Purchase Details
Closed on
Oct 17, 2000
Sold by
Jones Sherri L
Bought by
Stevens Ronald
Home Financials for this Owner
Home Financials are based on the most recent Mortgage that was taken out on this home.
Original Mortgage
$173,825
Interest Rate
7.7%
Mortgage Type
FHA
Purchase Details
Closed on
Apr 7, 1995
Sold by
Ariana Holdings Inc
Bought by
Jones Sherri L
Purchase Details
Closed on
Nov 30, 1994
Sold by
Gore Thomas and Gore Thomas U
Bought by
Ariana Holdings Inc
Create a Home Valuation Report for This Property
The Home Valuation Report is an in-depth analysis detailing your home's value as well as a comparison with similar homes in the area
Home Values in the Area
Average Home Value in this Area
Purchase History
| Date | Buyer | Sale Price | Title Company |
|---|---|---|---|
| Ashraf Anisha | $723,000 | -- | |
| Ashraf Anisha | $723,000 | -- | |
| Stevens Ronald | -- | -- | |
| Stevens Ronald | -- | -- | |
| Stevens Ronald | $180,000 | Stewart Title | |
| Stevens Ronald | $180,000 | Stewart Title | |
| Jones Sherri L | $140,000 | -- | |
| Jones Sherri L | $140,000 | -- | |
| Ariana Holdings Inc | $61,000 | Uslife Title Insurance Compa | |
| Ariana Holdings Inc | $61,000 | Uslife Title Insurance Compa |
Source: Public Records
Mortgage History
| Date | Status | Borrower | Loan Amount |
|---|---|---|---|
| Open | Ashraf Anisha | $397,650 | |
| Closed | Ashraf Anisha | $397,650 | |
| Previous Owner | Stevens Ronald | $173,825 |
Source: Public Records
Tax History Compared to Growth
Tax History
| Year | Tax Paid | Tax Assessment Tax Assessment Total Assessment is a certain percentage of the fair market value that is determined by local assessors to be the total taxable value of land and additions on the property. | Land | Improvement |
|---|---|---|---|---|
| 2025 | $4,640 | $25,940 | $9,198 | $16,742 |
| 2024 | $4,652 | $24,504 | $8,295 | $16,209 |
| 2023 | $4,597 | $24,290 | $7,290 | $17,000 |
| 2022 | $4,291 | $41,340 | $13,020 | $28,320 |
| 2021 | $4,258 | $36,360 | $13,020 | $23,340 |
| 2020 | $4,280 | $33,240 | $13,020 | $20,220 |
| 2019 | $3,979 | $28,920 | $13,020 | $15,900 |
| 2018 | $3,829 | $20,242 | $8,838 | $11,404 |
| 2017 | $3,595 | $19,108 | $9,235 | $9,873 |
| 2016 | $3,295 | $19,108 | $9,235 | $9,873 |
| 2015 | $1,954 | $18,014 | $10,963 | $7,051 |
| 2014 | $1,954 | $17,017 | $10,878 | $6,139 |
Source: Public Records
Map
Nearby Homes
- 10519 171st Place
- 172-09 108th Ave
- 106-03 177th St
- 173-61 105th Ave
- 17702 106th Rd
- 10828 174th St
- 177-18 106th Ave
- 108-32 174th St
- 10779 Watson Place
- 177-22 106th Rd
- 10529 171st St
- 10513 171st St
- 105-15 171st St
- 104-07 177th St
- 173-18 103rd Rd
- 177-33 106th Rd
- 17723 105th Ave
- 10331 177th St
- 108-46 171st Place
- 177-53 105th Ave
- 17425 Polhemus Ave
- 17419 Polhemus Ave
- 174-31 Polhemus Ave
- 17429 Polhemus Ave
- 17417 Polhemus Ave
- 174-17 Polhemus Ave
- 17431 Polhemus Ave
- 17411 Polhemus Ave
- 17435 Polhemus Ave
- 17435 Polhemus Ave
- 17437 Polhemus Ave
- 174-32 Polhemus Ave
- 10705 Fern Place
- 107-15 Fern Place
- 17318 106th Ave
- 17407 Polhemus Ave
- 10619 173rd St
- 174-36 Polhemus Ave
- 174-07 Polhemus Ave