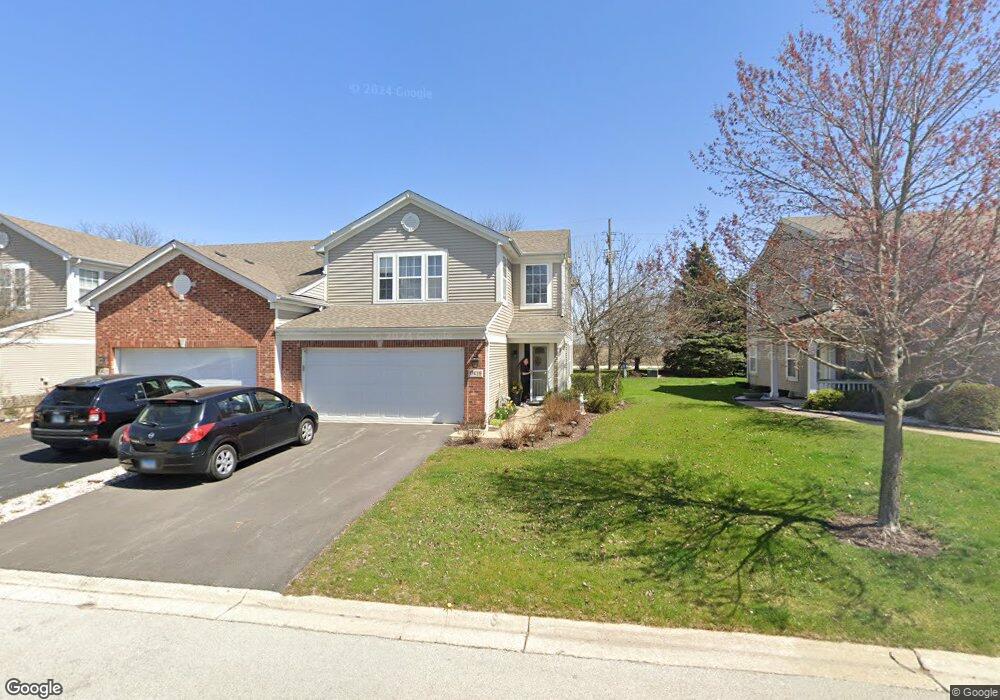
17429 Fox Bend Ln Lockport, IL 60441
Estimated Value: $288,000 - $310,000
--
Bed
--
Bath
1,484
Sq Ft
$199/Sq Ft
Est. Value
About This Home
This home is located at 17429 Fox Bend Ln, Lockport, IL 60441 and is currently estimated at $295,361, approximately $199 per square foot. 17429 Fox Bend Ln is a home located in Will County with nearby schools including William J. Butler, Hadley Middle School, and Homer Jr High School.
Ownership History
Date
Name
Owned For
Owner Type
Purchase Details
Closed on
Oct 22, 2007
Sold by
Krzemien Anna
Bought by
Krzemien Anna and Gorgol Andrzej
Current Estimated Value
Home Financials for this Owner
Home Financials are based on the most recent Mortgage that was taken out on this home.
Original Mortgage
$156,000
Outstanding Balance
$95,622
Interest Rate
5.87%
Mortgage Type
Stand Alone Refi Refinance Of Original Loan
Estimated Equity
$199,739
Purchase Details
Closed on
May 26, 2005
Sold by
Cozzolino Paul R
Bought by
Krzemien Anna
Home Financials for this Owner
Home Financials are based on the most recent Mortgage that was taken out on this home.
Original Mortgage
$134,800
Interest Rate
5.87%
Mortgage Type
Fannie Mae Freddie Mac
Purchase Details
Closed on
Mar 1, 2001
Sold by
Centex Homes
Bought by
Cozzolino Paul R
Home Financials for this Owner
Home Financials are based on the most recent Mortgage that was taken out on this home.
Original Mortgage
$132,576
Interest Rate
7.03%
Mortgage Type
Purchase Money Mortgage
Create a Home Valuation Report for This Property
The Home Valuation Report is an in-depth analysis detailing your home's value as well as a comparison with similar homes in the area
Home Values in the Area
Average Home Value in this Area
Purchase History
| Date | Buyer | Sale Price | Title Company |
|---|---|---|---|
| Krzemien Anna | -- | First American Title | |
| Krzemien Anna | $168,500 | Chicago Title Insurance Comp | |
| Cozzolino Paul R | $144,000 | Chicago Title Insurance Co |
Source: Public Records
Mortgage History
| Date | Status | Borrower | Loan Amount |
|---|---|---|---|
| Open | Krzemien Anna | $156,000 | |
| Closed | Krzemien Anna | $134,800 | |
| Previous Owner | Cozzolino Paul R | $132,576 |
Source: Public Records
Tax History Compared to Growth
Tax History
| Year | Tax Paid | Tax Assessment Tax Assessment Total Assessment is a certain percentage of the fair market value that is determined by local assessors to be the total taxable value of land and additions on the property. | Land | Improvement |
|---|---|---|---|---|
| 2024 | $6,545 | $82,735 | $13,001 | $69,734 |
| 2023 | $6,545 | $74,996 | $11,785 | $63,211 |
| 2022 | $6,252 | $63,189 | $10,189 | $53,000 |
| 2021 | $5,124 | $59,866 | $9,653 | $50,213 |
| 2020 | $5,095 | $57,663 | $9,298 | $48,365 |
| 2019 | $4,892 | $55,472 | $8,945 | $46,527 |
| 2018 | $4,772 | $53,495 | $8,842 | $44,653 |
| 2017 | $4,690 | $51,997 | $8,594 | $43,403 |
| 2016 | $4,578 | $50,263 | $8,307 | $41,956 |
| 2015 | $4,446 | $48,376 | $7,995 | $40,381 |
| 2014 | $4,446 | $47,377 | $7,830 | $39,547 |
| 2013 | $4,446 | $47,377 | $7,830 | $39,547 |
Source: Public Records
Map
Nearby Homes
- 16125-45 Bruce Rd
- 17542 Gilbert Dr Unit 404D
- 17526 S Gilbert Dr Unit 302D
- 17612 S Gilbert Dr
- 17437 Yakima Dr
- 17241 Arrow Head Dr
- 17326 Long Bow Dr
- 16335 Cagwin Dr Unit 2
- 17040 Cheyenne Ct
- 17302 Long Bow Dr
- 16146 W Oak Ave
- 17234 Long Bow Dr
- 17825 S Alta Dr
- 15959 Prairie View Ct Unit T6
- 15949 Prairie View Ct Unit T5
- The Lauren Plan at Prairie Ridge North
- The Grace Plan at Prairie Ridge North
- The Katherine Front Porch Elevation Plan at Prairie Ridge North
- 16556 W Apache Dr
- 16556 Willow Walk Dr
- 17427 Fox Bend Ln
- 17433 Fox Bend Ln
- 17425 Fox Bend Ln
- 17425 Fox Bend Ln Unit 1
- 17435 Fox Bend Ln Unit 2
- 17423 Fox Bend Ln
- 17253 S Gougar Rd
- 17437 Fox Bend Ln
- 17439 Fox Bend Ln
- 17432 Fox Bend Ln Unit 2
- 17419 Fox Bend Ln
- 17441 Fox Bend Ln
- 17441 Fox Bend Ln Unit 7441
- 17430 Fox Bend Ln Unit 2
- 17417 Fox Bend Ln
- 16018 Tiger Dr Unit 2
- 17443 Fox Bend Ln
- 17428 Fox Bend Ln
- 16020 Tiger Dr
- 17415 Fox Bend Ln