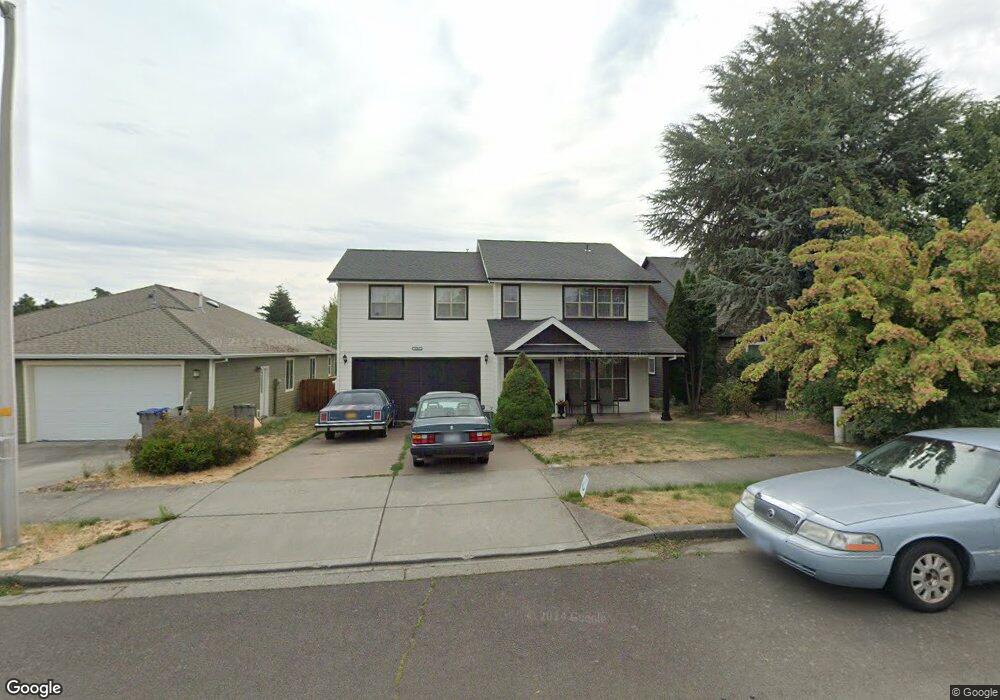
1743 22nd St Hood River, OR 97031
Estimated Value: $698,000 - $735,858
4
Beds
3
Baths
1,904
Sq Ft
$377/Sq Ft
Est. Value
About This Home
This home is located at 1743 22nd St, Hood River, OR 97031 and is currently estimated at $716,929, approximately $376 per square foot. 1743 22nd St is a home located in Hood River County with nearby schools including Westside Elementary School, Hood River Middle School, and Hood River Valley High School.
Ownership History
Date
Name
Owned For
Owner Type
Purchase Details
Closed on
Jul 6, 2005
Sold by
Vazquez Noe
Bought by
Vazquez Noe and Anguino Eloisa
Current Estimated Value
Home Financials for this Owner
Home Financials are based on the most recent Mortgage that was taken out on this home.
Original Mortgage
$57,200
Interest Rate
5.72%
Mortgage Type
Stand Alone Second
Purchase Details
Closed on
Jun 6, 2005
Sold by
Hrb Investments Llc
Bought by
Vazquez Now
Home Financials for this Owner
Home Financials are based on the most recent Mortgage that was taken out on this home.
Original Mortgage
$57,200
Interest Rate
5.72%
Mortgage Type
Stand Alone Second
Create a Home Valuation Report for This Property
The Home Valuation Report is an in-depth analysis detailing your home's value as well as a comparison with similar homes in the area
Home Values in the Area
Average Home Value in this Area
Purchase History
| Date | Buyer | Sale Price | Title Company |
|---|---|---|---|
| Vazquez Noe | -- | None Available | |
| Vazquez Now | $286,000 | Amerititle |
Source: Public Records
Mortgage History
| Date | Status | Borrower | Loan Amount |
|---|---|---|---|
| Closed | Vazquez Now | $57,200 |
Source: Public Records
Tax History Compared to Growth
Tax History
| Year | Tax Paid | Tax Assessment Tax Assessment Total Assessment is a certain percentage of the fair market value that is determined by local assessors to be the total taxable value of land and additions on the property. | Land | Improvement |
|---|---|---|---|---|
| 2024 | $5,054 | $337,750 | $185,700 | $152,050 |
| 2023 | $5,054 | $327,920 | $180,290 | $147,630 |
| 2022 | $4,670 | $318,370 | $66,900 | $251,470 |
| 2021 | $4,692 | $309,100 | $64,950 | $244,150 |
| 2020 | $4,536 | $300,100 | $63,060 | $237,040 |
| 2019 | $4,232 | $291,360 | $61,220 | $230,140 |
| 2018 | $4,275 | $282,880 | $59,440 | $223,440 |
| 2017 | $4,197 | $274,650 | $57,710 | $216,940 |
| 2016 | $4,091 | $266,660 | $56,030 | $210,630 |
| 2015 | $4,018 | $258,900 | $54,400 | $204,500 |
| 2014 | $3,957 | $251,360 | $52,810 | $198,550 |
| 2013 | -- | $244,040 | $51,270 | $192,770 |
Source: Public Records
Map
Nearby Homes