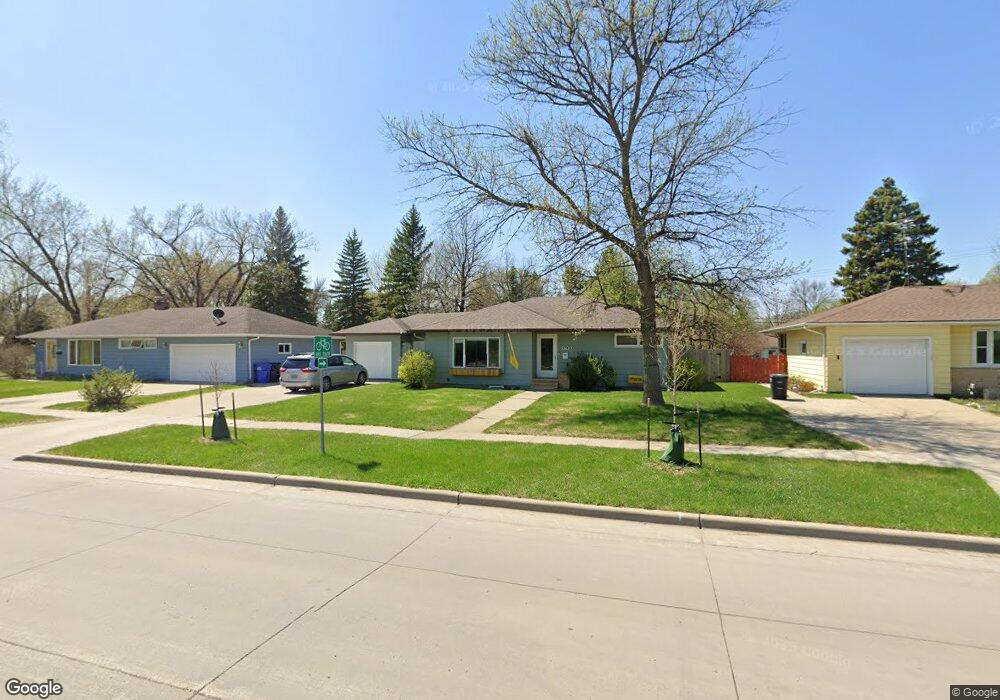
1743 5th St S Fargo, ND 58103
Clara Barton NeighborhoodEstimated Value: $271,000 - $295,000
3
Beds
2
Baths
1,328
Sq Ft
$216/Sq Ft
Est. Value
About This Home
This home is located at 1743 5th St S, Fargo, ND 58103 and is currently estimated at $287,399, approximately $216 per square foot. 1743 5th St S is a home located in Cass County with nearby schools including Clara Barton Elementary School, Carl Ben Eielson Middle School, and South High School.
Ownership History
Date
Name
Owned For
Owner Type
Purchase Details
Closed on
Jun 4, 2014
Sold by
Apex Properties Llc
Bought by
Beckerman Luke J and Beckerman Shannon K
Current Estimated Value
Home Financials for this Owner
Home Financials are based on the most recent Mortgage that was taken out on this home.
Original Mortgage
$142,000
Outstanding Balance
$107,927
Interest Rate
4.18%
Mortgage Type
New Conventional
Estimated Equity
$179,472
Purchase Details
Closed on
May 21, 2012
Sold by
Halvorson Matthew D and The 1017 Parker Ranchettes Tru Erik J
Bought by
Apex Properties Llc
Purchase Details
Closed on
Apr 14, 2012
Sold by
Barbara A Holvik Irrevocable Trust
Bought by
Halvorson Matthew D and Swenson Erik J
Create a Home Valuation Report for This Property
The Home Valuation Report is an in-depth analysis detailing your home's value as well as a comparison with similar homes in the area
Home Values in the Area
Average Home Value in this Area
Purchase History
| Date | Buyer | Sale Price | Title Company |
|---|---|---|---|
| Beckerman Luke J | $162,000 | Fm Title | |
| Apex Properties Llc | -- | None Available | |
| Halvorson Matthew D | -- | None Available |
Source: Public Records
Mortgage History
| Date | Status | Borrower | Loan Amount |
|---|---|---|---|
| Open | Beckerman Luke J | $142,000 |
Source: Public Records
Tax History Compared to Growth
Tax History
| Year | Tax Paid | Tax Assessment Tax Assessment Total Assessment is a certain percentage of the fair market value that is determined by local assessors to be the total taxable value of land and additions on the property. | Land | Improvement |
|---|---|---|---|---|
| 2024 | $3,711 | $141,500 | $34,250 | $107,250 |
| 2023 | $3,944 | $132,250 | $34,250 | $98,000 |
| 2022 | $3,647 | $119,150 | $34,250 | $84,900 |
| 2021 | $3,492 | $115,550 | $37,200 | $78,350 |
| 2020 | $3,476 | $115,550 | $37,200 | $78,350 |
| 2019 | $3,256 | $108,000 | $23,250 | $84,750 |
| 2018 | $3,219 | $108,000 | $23,250 | $84,750 |
| 2017 | $3,108 | $104,850 | $23,250 | $81,600 |
| 2016 | $2,812 | $101,800 | $23,250 | $78,550 |
| 2015 | $2,668 | $89,700 | $15,800 | $73,900 |
| 2014 | $2,554 | $83,050 | $15,800 | $67,250 |
| 2013 | $2,556 | $83,050 | $15,800 | $67,250 |
Source: Public Records
Map
Nearby Homes