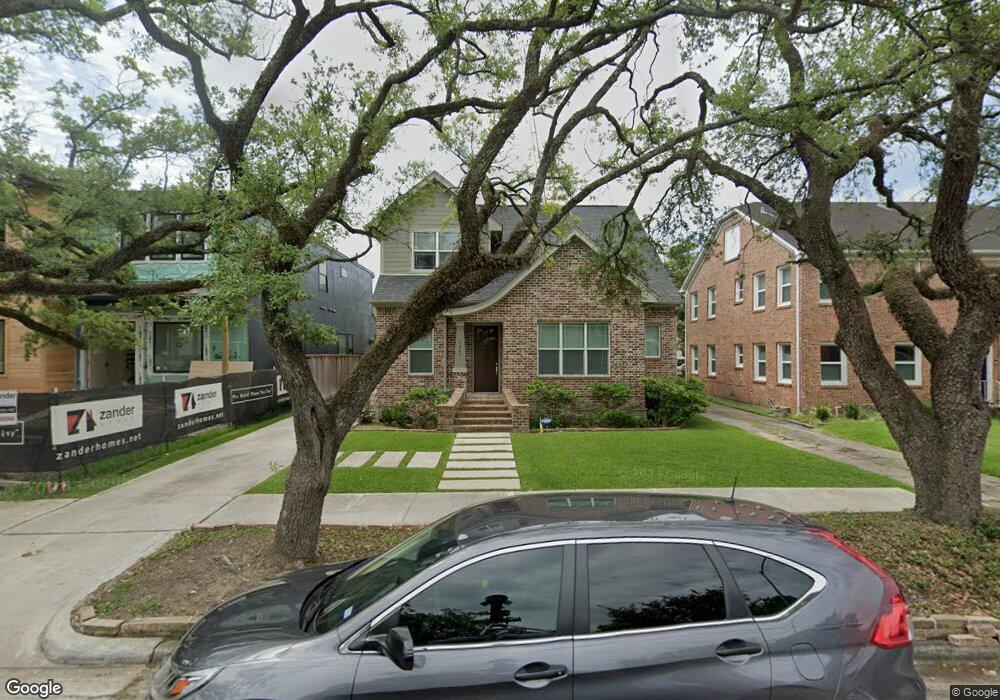
1743 Colquitt St Houston, TX 77098
Montrose NeighborhoodEstimated Value: $1,306,000 - $1,497,192
4
Beds
5
Baths
3,576
Sq Ft
$392/Sq Ft
Est. Value
About This Home
This home is located at 1743 Colquitt St, Houston, TX 77098 and is currently estimated at $1,400,298, approximately $391 per square foot. 1743 Colquitt St is a home located in Harris County with nearby schools including Poe Elementary School, Lanier Middle School, and Lamar High School.
Ownership History
Date
Name
Owned For
Owner Type
Purchase Details
Closed on
Feb 7, 2018
Sold by
Branchwood Development Llc
Bought by
Dickinson John Agnew and Wilson Nancy Lee
Current Estimated Value
Home Financials for this Owner
Home Financials are based on the most recent Mortgage that was taken out on this home.
Original Mortgage
$900,000
Outstanding Balance
$762,219
Interest Rate
3.99%
Mortgage Type
New Conventional
Estimated Equity
$638,079
Purchase Details
Closed on
Oct 18, 2016
Sold by
Inner Loop Holdings Ltd
Bought by
Branchwood Development Llc
Home Financials for this Owner
Home Financials are based on the most recent Mortgage that was taken out on this home.
Original Mortgage
$771,176
Interest Rate
3.44%
Mortgage Type
Purchase Money Mortgage
Create a Home Valuation Report for This Property
The Home Valuation Report is an in-depth analysis detailing your home's value as well as a comparison with similar homes in the area
Home Values in the Area
Average Home Value in this Area
Purchase History
| Date | Buyer | Sale Price | Title Company |
|---|---|---|---|
| Dickinson John Agnew | -- | Chicago Title | |
| Branchwood Development Llc | -- | Veritas Title Partners |
Source: Public Records
Mortgage History
| Date | Status | Borrower | Loan Amount |
|---|---|---|---|
| Open | Dickinson John Agnew | $900,000 | |
| Previous Owner | Branchwood Development Llc | $771,176 |
Source: Public Records
Tax History Compared to Growth
Tax History
| Year | Tax Paid | Tax Assessment Tax Assessment Total Assessment is a certain percentage of the fair market value that is determined by local assessors to be the total taxable value of land and additions on the property. | Land | Improvement |
|---|---|---|---|---|
| 2025 | $14,527 | $1,501,142 | $750,000 | $751,142 |
| 2024 | $14,527 | $1,484,368 | $687,500 | $796,868 |
| 2023 | $14,527 | $1,350,637 | $687,500 | $663,137 |
| 2022 | $27,972 | $1,270,360 | $500,000 | $770,360 |
| 2021 | $27,968 | $1,200,000 | $500,000 | $700,000 |
| 2020 | $29,967 | $1,302,558 | $500,000 | $802,558 |
| 2019 | $28,467 | $1,125,000 | $500,000 | $625,000 |
| 2018 | $26,209 | $1,125,000 | $468,750 | $656,250 |
| 2017 | $12,439 | $468,750 | $468,750 | $0 |
| 2016 | $10,783 | $406,350 | $406,250 | $100 |
| 2015 | $8,740 | $424,924 | $375,000 | $49,924 |
| 2014 | $8,740 | $340,000 | $339,900 | $100 |
Source: Public Records
Map
Nearby Homes
- 1802 Portsmouth St
- 1721 Colquitt St
- 1818 Colquitt St
- 1826 Portsmouth St
- 1737 Branard St
- 1648 Richmond Ave
- 1819 Branard St
- 1656 Norfolk St
- 1648 Colquitt St
- 1844 Colquitt St
- 1849 Portsmouth St
- 1849 W Main St Unit 15
- 1620, 1624 & 1630 Richmond Ave
- 1805 Sul Ross St
- 1655 Castle Ct
- 4509 Hazard St
- 1615 W Main St
- 1614 Norfolk St Unit C
- 1637 Castle Ct
- 1635 Castle Ct
- 1747 Colquitt St
- 1749 Colquitt St
- 1737 Colquitt St
- 1735 Colquitt St
- 1751 Colquitt St
- 1736 Richmond Ave
- 1736 Richmond Ave
- 1742 Richmond Ave
- 1744 Richmond Ave
- 1736B Richmond Ave
- 1727 Colquitt St
- 1755 Colquitt St Unit 2
- 1755 Colquitt St Unit 5
- 1755 Colquitt St Unit 10
- 1755 Colquitt St Unit 806
- 1755 Colquitt St Unit 805
- 1755 Colquitt St Unit 605
- 1755 Colquitt St Unit 3
- 1755 Colquitt St Unit 11
- 1755 Colquitt St Unit 9