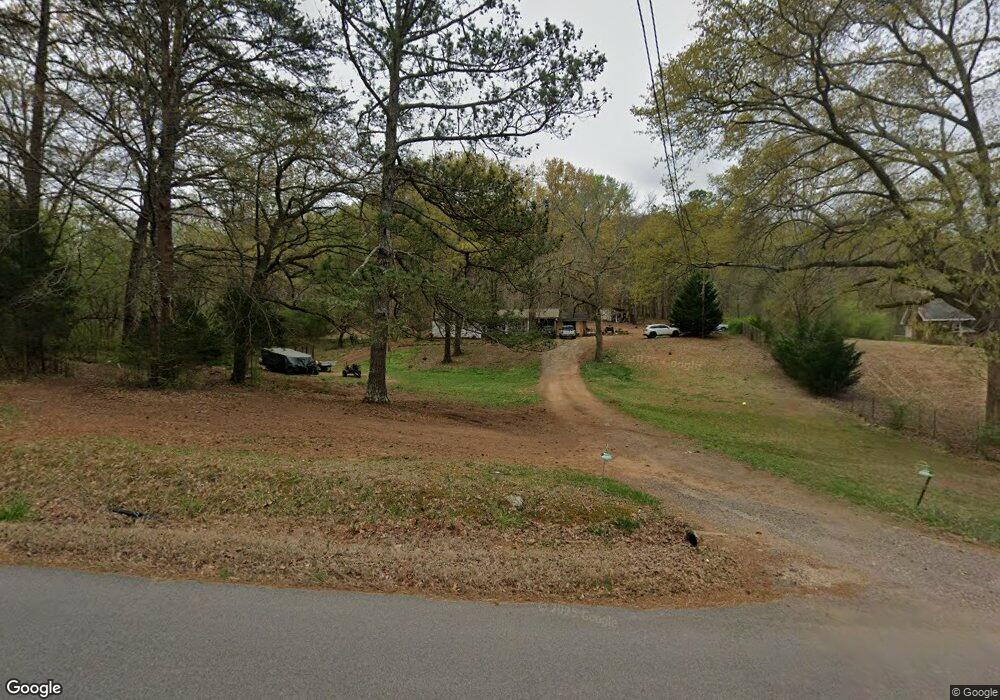
1743 Davis Rd SW Cave Spring, GA 30124
Estimated Value: $172,000 - $220,850
3
Beds
2
Baths
1,507
Sq Ft
$138/Sq Ft
Est. Value
About This Home
This home is located at 1743 Davis Rd SW, Cave Spring, GA 30124 and is currently estimated at $207,213, approximately $137 per square foot. 1743 Davis Rd SW is a home located in Floyd County with nearby schools including Coosa Middle School and Coosa High School.
Ownership History
Date
Name
Owned For
Owner Type
Purchase Details
Closed on
Sep 30, 2022
Sold by
Robinson Christopher
Bought by
Williams Tommy
Current Estimated Value
Purchase Details
Closed on
Aug 16, 2012
Bought by
P and R
Purchase Details
Closed on
Aug 26, 2010
Sold by
Abernathy Kevin B
Bought by
Robinson Christopher
Home Financials for this Owner
Home Financials are based on the most recent Mortgage that was taken out on this home.
Original Mortgage
$93,154
Interest Rate
4.6%
Mortgage Type
New Conventional
Purchase Details
Closed on
Dec 5, 2006
Sold by
Not Provided
Bought by
Robinson Christopher
Purchase Details
Closed on
Feb 7, 2006
Sold by
Not Provided
Bought by
Robinson Christopher
Purchase Details
Closed on
Oct 9, 2003
Bought by
P and R
Purchase Details
Closed on
Jun 1, 1971
Bought by
P and R
Purchase Details
Closed on
Jul 3, 1967
Bought by
Gladden Wayman H
Create a Home Valuation Report for This Property
The Home Valuation Report is an in-depth analysis detailing your home's value as well as a comparison with similar homes in the area
Purchase History
| Date | Buyer | Sale Price | Title Company |
|---|---|---|---|
| Williams Tommy | $90,000 | -- | |
| P | -- | -- | |
| Robinson Christopher | $89,900 | -- | |
| Robinson Christopher | $52,900 | -- | |
| Robinson Christopher | $51,000 | -- | |
| P | -- | -- | |
| P | -- | -- | |
| Gladden Wayman H | -- | -- |
Source: Public Records
Mortgage History
| Date | Status | Borrower | Loan Amount |
|---|---|---|---|
| Previous Owner | Robinson Christopher | $93,154 |
Source: Public Records
Tax History
| Year | Tax Paid | Tax Assessment Tax Assessment Total Assessment is a certain percentage of the fair market value that is determined by local assessors to be the total taxable value of land and additions on the property. | Land | Improvement |
|---|---|---|---|---|
| 2025 | $1,924 | $76,939 | $19,008 | $57,931 |
| 2024 | $1,924 | $70,413 | $16,896 | $53,517 |
| 2023 | $1,032 | $61,107 | $15,360 | $45,747 |
| 2022 | $1,524 | $51,364 | $12,672 | $38,692 |
| 2021 | $1,302 | $43,134 | $11,533 | $31,601 |
| 2020 | $1,214 | $39,883 | $10,029 | $29,854 |
| 2019 | $1,162 | $38,674 | $10,029 | $28,645 |
| 2018 | $1,111 | $36,942 | $9,552 | $27,390 |
| 2017 | $1,074 | $35,628 | $8,845 | $26,783 |
| 2016 | $1,022 | $33,495 | $8,840 | $24,655 |
| 2015 | $999 | $33,495 | $8,840 | $24,655 |
| 2014 | $999 | $33,495 | $8,840 | $24,655 |
Source: Public Records
Map
Nearby Homes
- 0 Mill Rd Unit 10629874
- 0 Mill Rd Unit 7670319
- 475 Davis Rd SW
- 57 Mill St
- 38 Alabama St
- 0 Mill St SW Unit 11671446
- 5598 Fosters Mill Rd
- 700 Gadsden Rd SW
- 0 Melson Rd SW Unit 7676052
- 0 Melson Rd SW Unit 10636997
- 7112 C Blacks Bluff Rd
- 5981 Blacks Bluff Rd SW
- 907 Gadsden Rd SW
- 914 Chubbtown Rd
- 0 Booger Hollow Rd
- 612 Michael Blvd
- 387 Michael Blvd
- 4458 Old Blacks Bluff Rd SW
- 0 Old Blacks Bluff Rd SW Unit 10652523
- 0 Santa Claus Rd Unit 7735787
- 1767 Davis Rd SW
- 1775 Davis Rd SW
- 1778 Davis Rd SW
- 1776 Davis Rd SW
- 5 Elaine Dr SW
- 3 Elaine Dr SW
- 1779 Davis Rd SW
- 1786 Davis Rd SW
- 22 Elaine Dr SW
- 0 Elaine Dr SW Unit 8259062
- 2 Davis Rd SW
- 4 Elaine Dr SW
- 7 Elaine Dr SW
- 7 Elaine Dr SW
- 1706 Davis Rd SW
- 7339 Cave Spring Rd SW
- 7385 Cave Spring Rd SW
- 7295 Cave Spring Rd SW
- 8 Elaine Dr SW
- 19 Elaine Dr SW
Your Personal Tour Guide
Ask me questions while you tour the home.