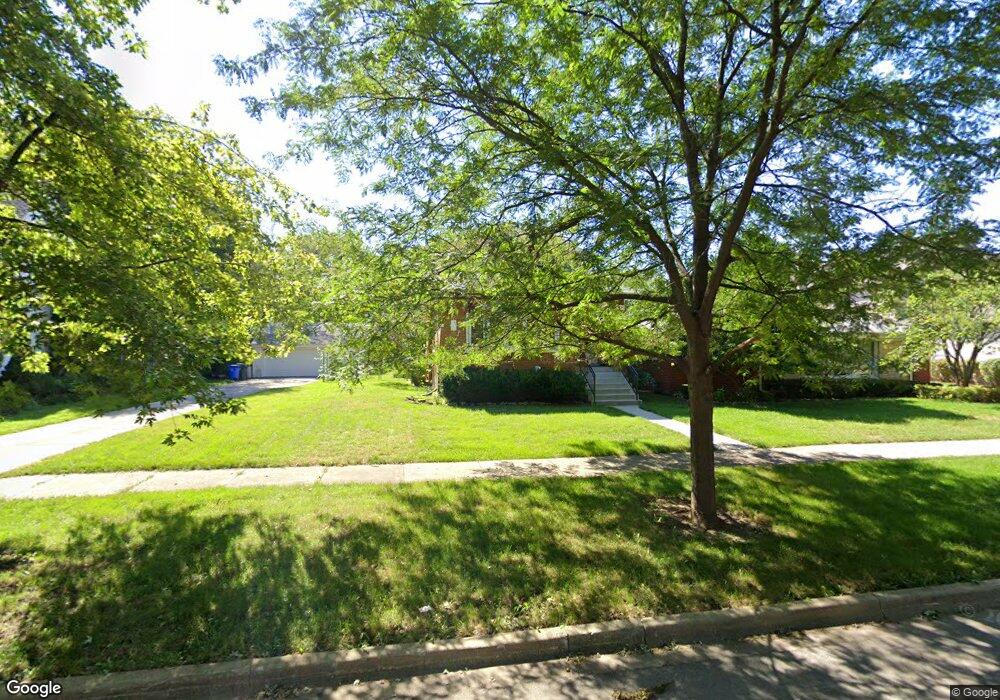
1743 E Forest Ave Des Plaines, IL 60018
Estimated Value: $513,991 - $585,000
4
Beds
2
Baths
2,390
Sq Ft
$229/Sq Ft
Est. Value
About This Home
This home is located at 1743 E Forest Ave, Des Plaines, IL 60018 and is currently estimated at $548,248, approximately $229 per square foot. 1743 E Forest Ave is a home located in Cook County with nearby schools including Central Elementary School, Chippewa Middle School, and Maine West High School.
Ownership History
Date
Name
Owned For
Owner Type
Purchase Details
Closed on
Apr 12, 2017
Sold by
Hardt Joanne
Bought by
Dinse Kurt C and Dinse Stacie V
Current Estimated Value
Home Financials for this Owner
Home Financials are based on the most recent Mortgage that was taken out on this home.
Original Mortgage
$274,000
Outstanding Balance
$227,395
Interest Rate
4.37%
Mortgage Type
New Conventional
Estimated Equity
$320,853
Purchase Details
Closed on
Oct 12, 2007
Sold by
Miller John J and Miller Rebecca A
Bought by
Hardt Joanne
Home Financials for this Owner
Home Financials are based on the most recent Mortgage that was taken out on this home.
Original Mortgage
$344,000
Interest Rate
6.37%
Mortgage Type
Unknown
Create a Home Valuation Report for This Property
The Home Valuation Report is an in-depth analysis detailing your home's value as well as a comparison with similar homes in the area
Home Values in the Area
Average Home Value in this Area
Purchase History
| Date | Buyer | Sale Price | Title Company |
|---|---|---|---|
| Dinse Kurt C | $342,500 | Attorney | |
| Hardt Joanne | $430,000 | Pntn | |
| Hardt Joanne | $430,000 | Pntn |
Source: Public Records
Mortgage History
| Date | Status | Borrower | Loan Amount |
|---|---|---|---|
| Open | Dinse Kurt C | $274,000 | |
| Previous Owner | Hardt Joanne | $344,000 |
Source: Public Records
Tax History
| Year | Tax Paid | Tax Assessment Tax Assessment Total Assessment is a certain percentage of the fair market value that is determined by local assessors to be the total taxable value of land and additions on the property. | Land | Improvement |
|---|---|---|---|---|
| 2025 | $10,546 | $51,000 | $13,167 | $37,833 |
| 2024 | $10,546 | $40,000 | $11,704 | $28,296 |
| 2023 | $10,293 | $40,000 | $11,704 | $28,296 |
| 2022 | $10,293 | $40,000 | $11,704 | $28,296 |
| 2021 | $12,435 | $40,455 | $9,509 | $30,946 |
| 2020 | $12,225 | $40,455 | $9,509 | $30,946 |
| 2019 | $12,097 | $44,950 | $9,509 | $35,441 |
| 2018 | $9,901 | $33,108 | $8,412 | $24,696 |
| 2017 | $8,735 | $33,108 | $8,412 | $24,696 |
| 2016 | $8,506 | $33,108 | $8,412 | $24,696 |
| 2015 | $7,845 | $28,573 | $7,315 | $21,258 |
| 2014 | $7,696 | $28,573 | $7,315 | $21,258 |
| 2013 | $7,487 | $28,573 | $7,315 | $21,258 |
Source: Public Records
Map
Nearby Homes
- 1700 E Forest Ave
- 1990 Berry Ln
- 1640 S River Rd
- 1630 Henry Ave
- 1645 Illinois St
- 1689 S Elm St
- 1638 Oakwood Ave
- 1649 Ashland Ave Unit 501
- 1696 S Elm St
- 1524 Oakwood Ave
- 1721 Prospect Ave
- 1600 E Thacker St Unit 513
- 1445 Everett Ave
- 1380 Oakwood Ave Unit 306
- 905 Center St Unit B208
- 900 Center St Unit 3A
- 770 Pearson St Unit 808
- 711 S River Rd Unit 617
- 711 S River Rd Unit 704
- 821 Lexington Cir E
- 1733 E Forest Ave
- 1753 E Forest Ave
- 1763 E Forest Ave
- 1723 E Forest Ave
- 1773 E Forest Ave
- 1744 Wicke Ave
- 1736 Wicke Ave
- 1783 E Forest Ave
- 1744 E Forest Ave
- 1407 Orchard St
- 1415 Orchard St
- 1754 E Forest Ave
- 1754 Wicke Ave
- 1401 Orchard St
- 1734 E Forest Ave
- 1425 Orchard St
- 1724 Wicke Ave
- 1764 Wicke Ave
- 1764 E Forest Ave
- 1433 Orchard St
Your Personal Tour Guide
Ask me questions while you tour the home.