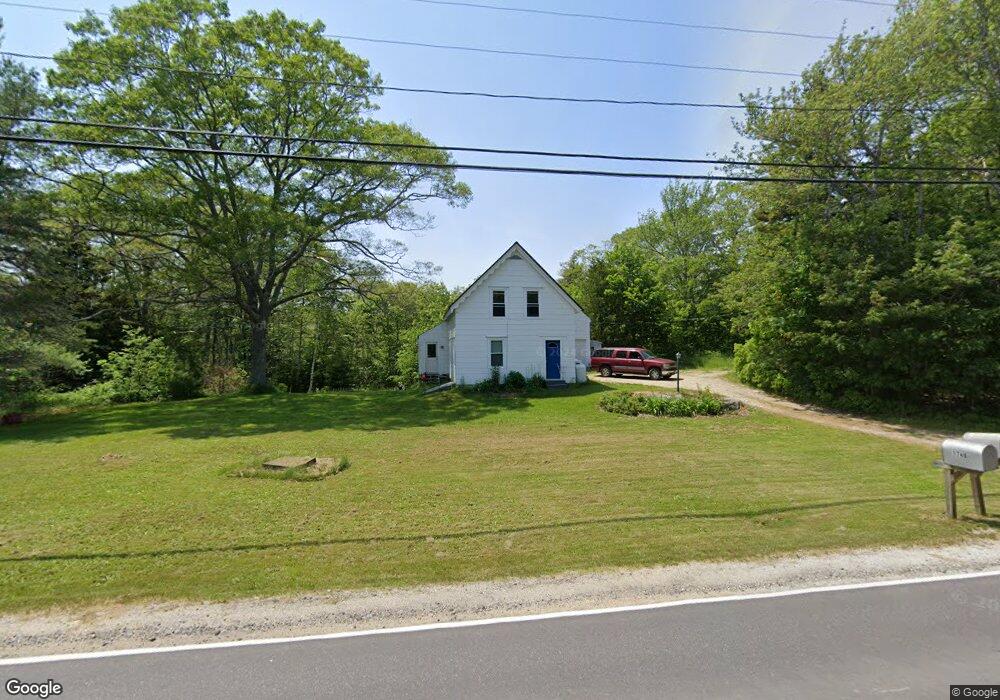
1743 Main Rd Phippsburg, ME 04562
Phippsburg NeighborhoodEstimated Value: $275,520 - $601,000
4
Beds
1
Bath
520
Sq Ft
$857/Sq Ft
Est. Value
About This Home
This home is located at 1743 Main Rd, Phippsburg, ME 04562 and is currently estimated at $445,630, approximately $856 per square foot. 1743 Main Rd is a home with nearby schools including Morse High School.
Ownership History
Date
Name
Owned For
Owner Type
Purchase Details
Closed on
May 4, 2015
Sold by
Pye Fay F
Bought by
Pye Gordon F and Pye Kathleen B
Current Estimated Value
Home Financials for this Owner
Home Financials are based on the most recent Mortgage that was taken out on this home.
Original Mortgage
$80,000
Interest Rate
3.76%
Mortgage Type
Purchase Money Mortgage
Create a Home Valuation Report for This Property
The Home Valuation Report is an in-depth analysis detailing your home's value as well as a comparison with similar homes in the area
Home Values in the Area
Average Home Value in this Area
Purchase History
We collect this data history from publicly available records. To have your information removed, we recommend requesting removal directly through your county’s website.
| Date | Buyer | Sale Price | Title Company |
|---|---|---|---|
| Pye Gordon F | -- | -- |
Source: Public Records
Mortgage History
We collect this data history from publicly available records. To have your information removed, we recommend requesting removal directly through your county’s website.
| Date | Status | Borrower | Loan Amount |
|---|---|---|---|
| Closed | Pye Gordon F | $80,000 |
Source: Public Records
Tax History
| Year | Tax Paid | Tax Assessment Tax Assessment Total Assessment is a certain percentage of the fair market value that is determined by local assessors to be the total taxable value of land and additions on the property. | Land | Improvement |
|---|---|---|---|---|
| 2025 | $2,119 | $171,600 | $98,000 | $73,600 |
| 2024 | $2,021 | $171,600 | $98,000 | $73,600 |
| 2023 | $1,963 | $171,600 | $98,000 | $73,600 |
| 2022 | $1,737 | $171,600 | $98,000 | $73,600 |
| 2021 | $1,562 | $171,600 | $98,000 | $73,600 |
| 2020 | $52,276 | $171,600 | $98,000 | $73,600 |
| 2019 | $1,568 | $171,600 | $98,000 | $73,600 |
| 2018 | $57,458 | $171,600 | $98,000 | $73,600 |
| 2017 | $56,272 | $171,600 | $98,000 | $73,600 |
| 2016 | $1,496 | $171,600 | $98,000 | $73,600 |
| 2015 | $1,469 | $171,600 | $98,000 | $73,600 |
| 2014 | $1,338 | $171,600 | $98,000 | $73,600 |
Source: Public Records
Map
Nearby Homes
- 7 Wrong Way Dr
- 1682 &1676 Main Rd
- 0 Sebasco Rd
- Lot 5 Sagamore Dr
- Lot 3 Sagamore Dr
- 001 Popham Rd
- 63 Youngs Ln
- 823 Popham Rd
- 012 Long Island
- Lot 7-1 Captain John Parker Rd
- 37 Spar Cove Rd
- 943 Cundy's Harbor Rd
- Lot 18 Pasture Rd
- Lot# 9 Kennebec Shores Rd
- 20 Holbrook St
- 259 Marrtown Rd
- 27 Seacrest Cir
- 45 Island Hill Rd
- 15 Church Ln
- 15 Lupine Ln
Your Personal Tour Guide
Ask me questions while you tour the home.