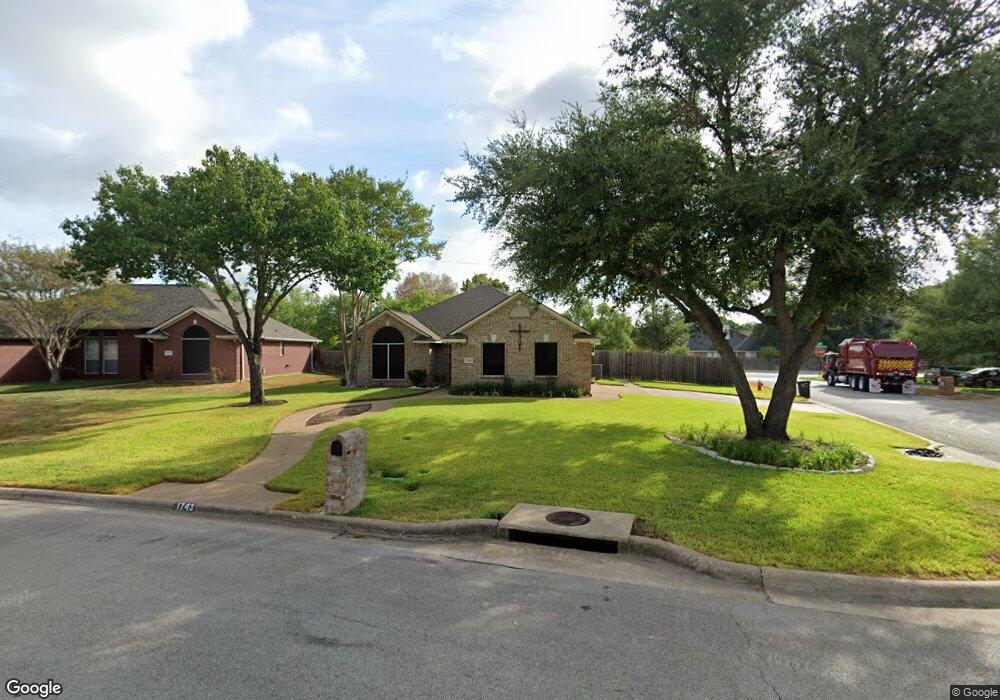
1743 Purple Martin Cove College Station, TX 77845
Estimated Value: $292,143 - $312,000
3
Beds
2
Baths
1,669
Sq Ft
$183/Sq Ft
Est. Value
About This Home
This home is located at 1743 Purple Martin Cove, College Station, TX 77845 and is currently estimated at $305,036, approximately $182 per square foot. 1743 Purple Martin Cove is a home located in Brazos County with nearby schools including Creek View Elementary School, Cypress Grove Intermediate School, and College Station Middle School.
Ownership History
Date
Name
Owned For
Owner Type
Purchase Details
Closed on
Sep 12, 2007
Sold by
Cave Bryan and Cave Vanessa
Bought by
Munguia Felix and Munguia Melva R
Current Estimated Value
Home Financials for this Owner
Home Financials are based on the most recent Mortgage that was taken out on this home.
Original Mortgage
$136,000
Outstanding Balance
$86,678
Interest Rate
6.7%
Mortgage Type
Purchase Money Mortgage
Estimated Equity
$218,358
Purchase Details
Closed on
May 1, 2007
Sold by
Scott Sherry Louise and Scott Ii Dwain
Bought by
Cave Bryan
Purchase Details
Closed on
Jul 27, 2005
Sold by
Herbert Wilma and Phillips Julia Herbert
Bought by
Scott Sherry Louise and Scott Ii Dwain
Home Financials for this Owner
Home Financials are based on the most recent Mortgage that was taken out on this home.
Original Mortgage
$110,000
Interest Rate
6.62%
Mortgage Type
Adjustable Rate Mortgage/ARM
Create a Home Valuation Report for This Property
The Home Valuation Report is an in-depth analysis detailing your home's value as well as a comparison with similar homes in the area
Home Values in the Area
Average Home Value in this Area
Purchase History
| Date | Buyer | Sale Price | Title Company |
|---|---|---|---|
| Munguia Felix | -- | University Title Company | |
| Cave Bryan | -- | University Title Company | |
| Scott Sherry Louise | -- | University Title Company |
Source: Public Records
Mortgage History
| Date | Status | Borrower | Loan Amount |
|---|---|---|---|
| Open | Munguia Felix | $136,000 | |
| Previous Owner | Scott Sherry Louise | $110,000 |
Source: Public Records
Tax History Compared to Growth
Tax History
| Year | Tax Paid | Tax Assessment Tax Assessment Total Assessment is a certain percentage of the fair market value that is determined by local assessors to be the total taxable value of land and additions on the property. | Land | Improvement |
|---|---|---|---|---|
| 2025 | $2,217 | $301,949 | -- | -- |
| 2024 | $2,217 | $274,499 | $57,500 | $216,999 |
| 2023 | $2,217 | $257,048 | $0 | $0 |
| 2022 | $4,982 | $233,680 | $0 | $0 |
| 2021 | $4,798 | $212,436 | $45,000 | $167,436 |
| 2020 | $4,573 | $201,336 | $45,000 | $156,336 |
| 2019 | $4,817 | $203,860 | $40,000 | $163,860 |
| 2018 | $4,433 | $187,750 | $40,000 | $147,750 |
| 2017 | $3,984 | $169,280 | $40,000 | $129,280 |
| 2016 | $3,796 | $161,290 | $30,000 | $131,290 |
| 2015 | $3,252 | $152,140 | $30,000 | $122,140 |
| 2014 | $3,252 | $149,240 | $30,000 | $119,240 |
Source: Public Records
Map
Nearby Homes
- 1732 Purple Martin Cove
- 1717 Starling Dr
- 3919 Hawk Owl Cove
- 3900 Puffin Way
- 3933 Oriole Ct
- 1742 Creekside Cir
- 1736 Creekside Cir
- 1722 Creekside Cir
- 1011 Dove Chase Ln
- 3718 Bridle Ct
- 3715 Bridle Ct
- 1027 Emerald Dove Ave
- 1303 Skyline Ct
- 915 Dove Run Trail
- 1412 Richland Ct S
- 912 Emerald Dove Ave
- 915 Emerald Dove Ave
- 1307 Portsmouth Ct
- 809 Dove Run Trail
- 902 Dove Landing Ave
- 1741 Purple Martin Cove
- 1734 Starling Dr
- 1736 Starling Dr
- 1723 Starling Dr
- 1732 Starling Dr
- 3930 Hawk Owl Cove
- 1730 Starling Dr
- 1802 Song Sparrow Ln
- 1737 Purple Martin Cove
- 1800 Song Sparrow Ln
- 1728 Starling Dr
- 1734 Purple Martin Cove
- 3929 Hawk Owl Cove
- 1735 Purple Martin Cove
- 1726 Starling Dr
- 3926 Hawk Owl Cove
- 1804 Song Sparrow Ln
- 1801 Song Sparrow Ln
- 1733 Purple Martin Cove
- 1724 Starling Dr