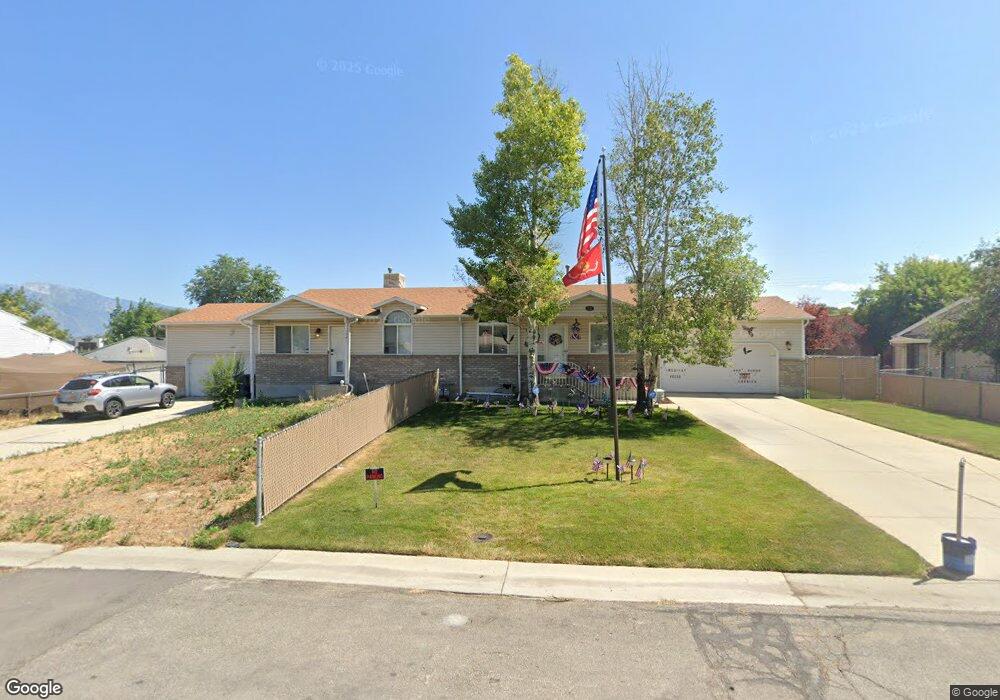
1743 W 6020 S Salt Lake City, UT 84129
Estimated Value: $411,000 - $462,000
3
Beds
2
Baths
832
Sq Ft
$520/Sq Ft
Est. Value
About This Home
This home is located at 1743 W 6020 S, Salt Lake City, UT 84129 and is currently estimated at $432,468, approximately $519 per square foot. 1743 W 6020 S is a home located in Salt Lake County with nearby schools including Calvin S Smith Elementary School, Bennion Junior High School, and Taylorsville High School.
Ownership History
Date
Name
Owned For
Owner Type
Purchase Details
Closed on
Jul 28, 1999
Sold by
Lovell Jens O and Lovell Amy Jo
Bought by
Griego James L
Current Estimated Value
Home Financials for this Owner
Home Financials are based on the most recent Mortgage that was taken out on this home.
Original Mortgage
$95,200
Outstanding Balance
$27,336
Interest Rate
7.64%
Estimated Equity
$405,132
Purchase Details
Closed on
Nov 20, 1995
Sold by
Lovell Jens O and Lovell Amy Jo
Bought by
Lovell Jens O and Lovell Amy Jo
Home Financials for this Owner
Home Financials are based on the most recent Mortgage that was taken out on this home.
Original Mortgage
$56,900
Interest Rate
7.8%
Purchase Details
Closed on
Oct 12, 1995
Sold by
Lovell Jens O and Lovell Amy Jo
Bought by
Lovell Jens O and Lovell Amy Jo
Home Financials for this Owner
Home Financials are based on the most recent Mortgage that was taken out on this home.
Original Mortgage
$56,900
Interest Rate
7.8%
Create a Home Valuation Report for This Property
The Home Valuation Report is an in-depth analysis detailing your home's value as well as a comparison with similar homes in the area
Home Values in the Area
Average Home Value in this Area
Purchase History
| Date | Buyer | Sale Price | Title Company |
|---|---|---|---|
| Griego James L | -- | Equity Title | |
| Lovell Jens O | -- | -- | |
| Lovell Jens O | -- | -- | |
| Lovell Jens O | -- | -- |
Source: Public Records
Mortgage History
| Date | Status | Borrower | Loan Amount |
|---|---|---|---|
| Open | Griego James L | $95,200 | |
| Previous Owner | Lovell Jens O | $56,900 |
Source: Public Records
Tax History Compared to Growth
Tax History
| Year | Tax Paid | Tax Assessment Tax Assessment Total Assessment is a certain percentage of the fair market value that is determined by local assessors to be the total taxable value of land and additions on the property. | Land | Improvement |
|---|---|---|---|---|
| 2025 | $2,464 | $437,900 | $159,300 | $278,600 |
| 2024 | $2,464 | $404,000 | $149,200 | $254,800 |
| 2023 | $2,242 | $360,600 | $143,500 | $217,100 |
| 2022 | $2,232 | $362,200 | $140,700 | $221,500 |
| 2021 | $2,063 | $291,600 | $108,300 | $183,300 |
| 2020 | $1,889 | $252,600 | $108,300 | $144,300 |
| 2019 | $1,809 | $236,300 | $102,100 | $134,200 |
| 2018 | $0 | $209,800 | $102,100 | $107,700 |
| 2017 | $1,461 | $193,300 | $102,100 | $91,200 |
| 2016 | $1,364 | $180,400 | $102,100 | $78,300 |
| 2015 | $1,449 | $179,100 | $81,200 | $97,900 |
| 2014 | -- | $172,800 | $78,900 | $93,900 |
Source: Public Records
Map
Nearby Homes
- 6189 S Elderberry Ln
- 5924 S Jordan Canal Rd
- 1506 W 6235 S
- 1471 W 6170 S
- 2137 W 6200 S
- 2126 W Happiness Dr
- 1297 Glencoe Dr
- 1429 Connie Way
- 2322 W Surrey Rd
- 2342 W 6200 S
- 1501 W Bluemont Dr
- 1481 W Bluemont Dr
- 5552 Hew Wood Dr
- 2001 W 5540 S
- 2127 Cedar Breaks Dr
- 1193 W Dun Robin Ct
- 1179 W Dun Robin Ct
- 5557 S 2200 W
- 2332 Broderick Dr
- 2333 W Ledgewood Dr
- 1741 W 6020 S
- 1773 W 6020 S
- 1735 W 6020 S
- 1789 W 6020 S Unit 1791
- 1791 W 6020 S
- 1766 W 6020 S
- 1750 W 6020 S
- 1782 W 6020 S
- 1805 W 6020 S
- 1798 W 6020 S
- 1814 W 6020 S
- 1840 W 6020 S
- 6092 S Redwood Rd
- 6092 S Redwood Rd
- 6050 S 1820 W
- 6174 S Redwood Rd
- 1840 W 6020 S
- 1855 W 6020 S
- 6007 S Redwood Rd
- 6065 S Redwood Rd